
Why we shouldn't want a New Gilded Age Part 4
Here is a multi step plan using many simulated models to come up with a better distribution of wealth, keep growth and pay down our national debt.

For this multi part series I will be using the Postwar Era as the example of what was a more equitable sharing of the nations wealth. Using that period has issues, social/cultural especially, but this series is not looking at those social/cultural issues, nor is it trying to obfuscate the suffering of those social groups. It’s being used only as a reference point for comparison of concentrations of wealth since the industrial revolution.
revised: 05/24/2025 7pm pst - fixed errors in formatting
When we hear folks say they are debit hawks but vote to give take breaks to the top 1%, they are boldface lying, they have no backbone. When folks talk about helping those at the bottom but don’t provide any real savings to stack on, true jobs that let them build wealth vs just providing government support, they are also lying. To truly fix our issue of wealth inequality and lower our debit will take a massive shift in our policies.
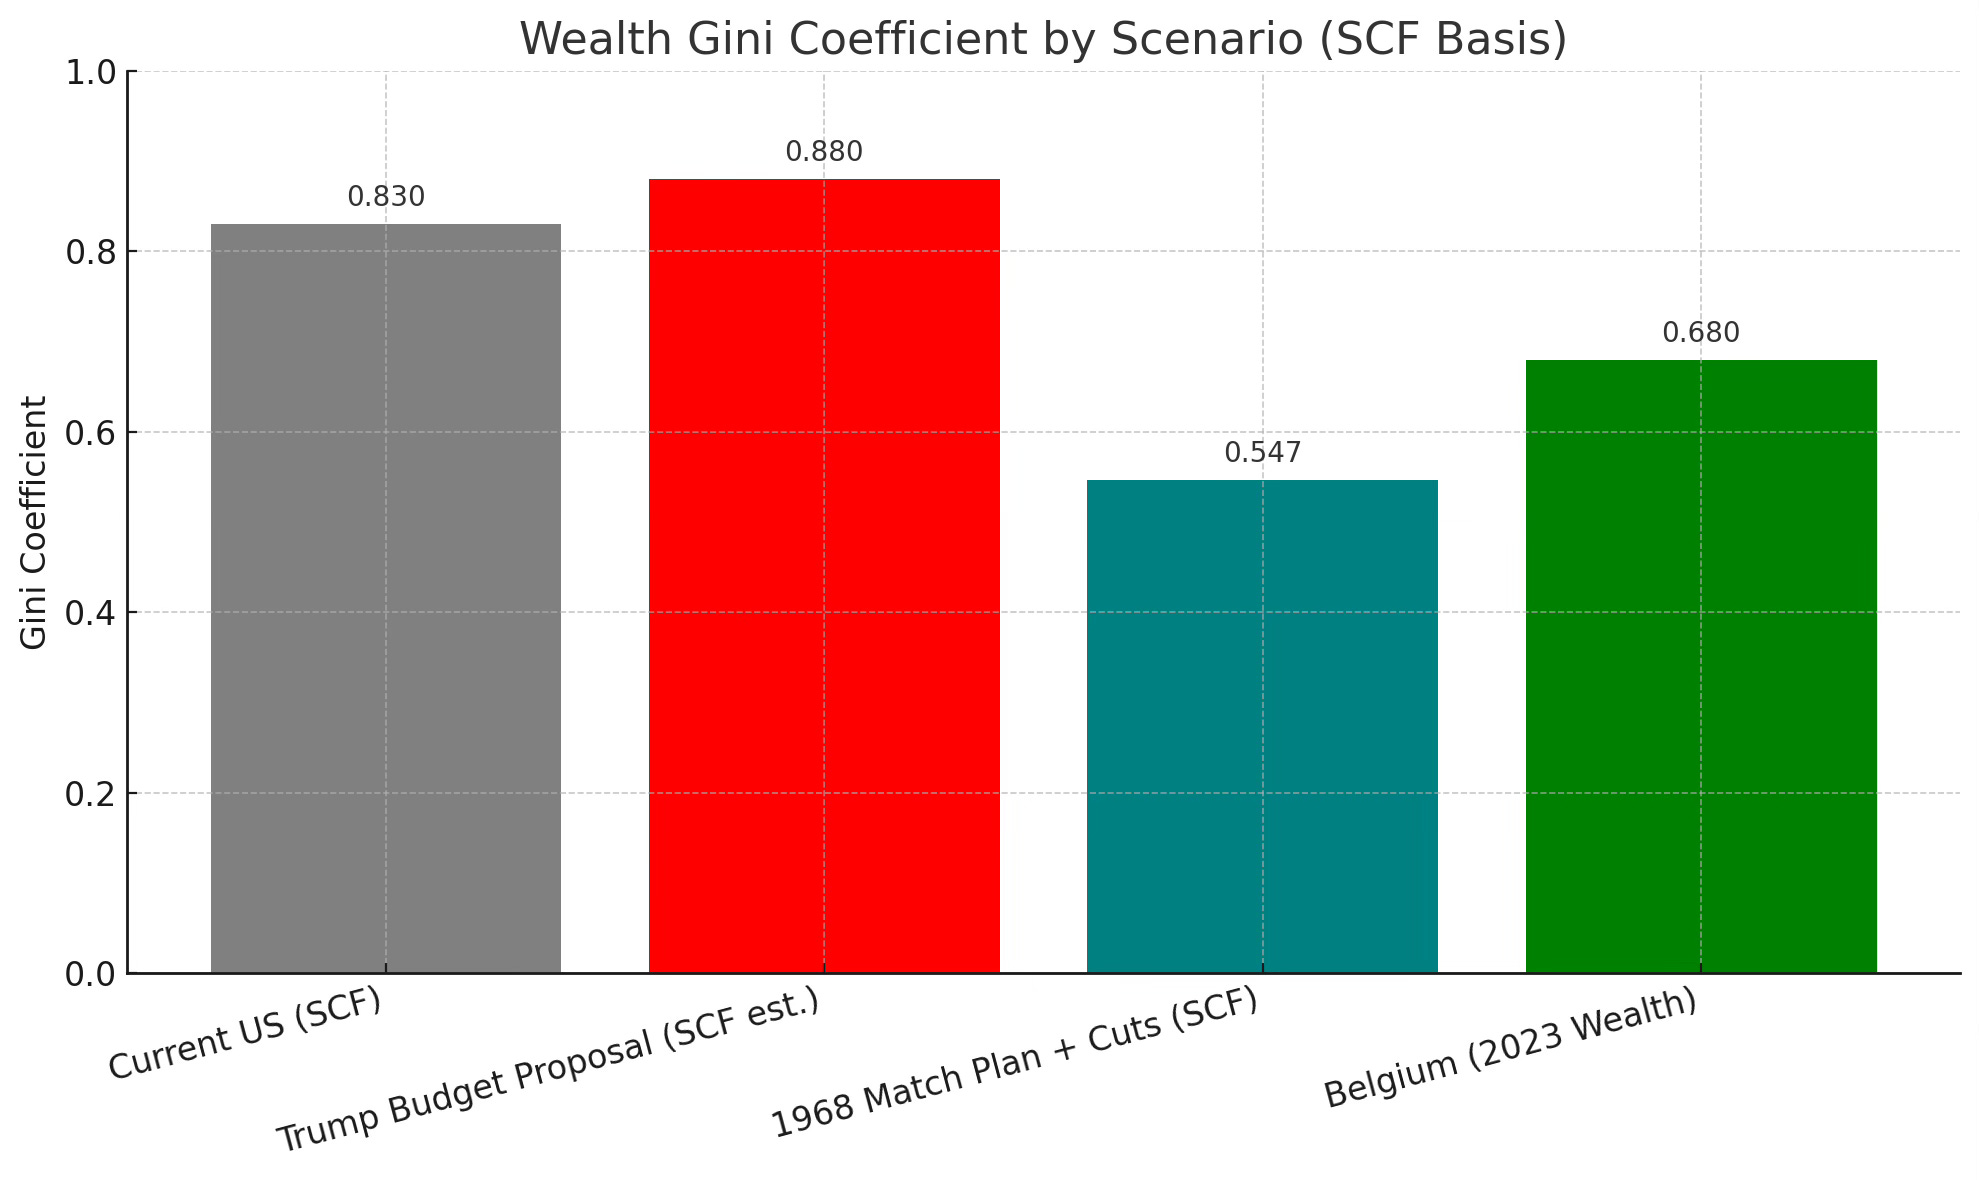
The Gini coefficient is used to describe the best wealth distribution, where 0 is the perfectly equal and 100 percent means 1 person holds all the wealth.
Using SCF here.
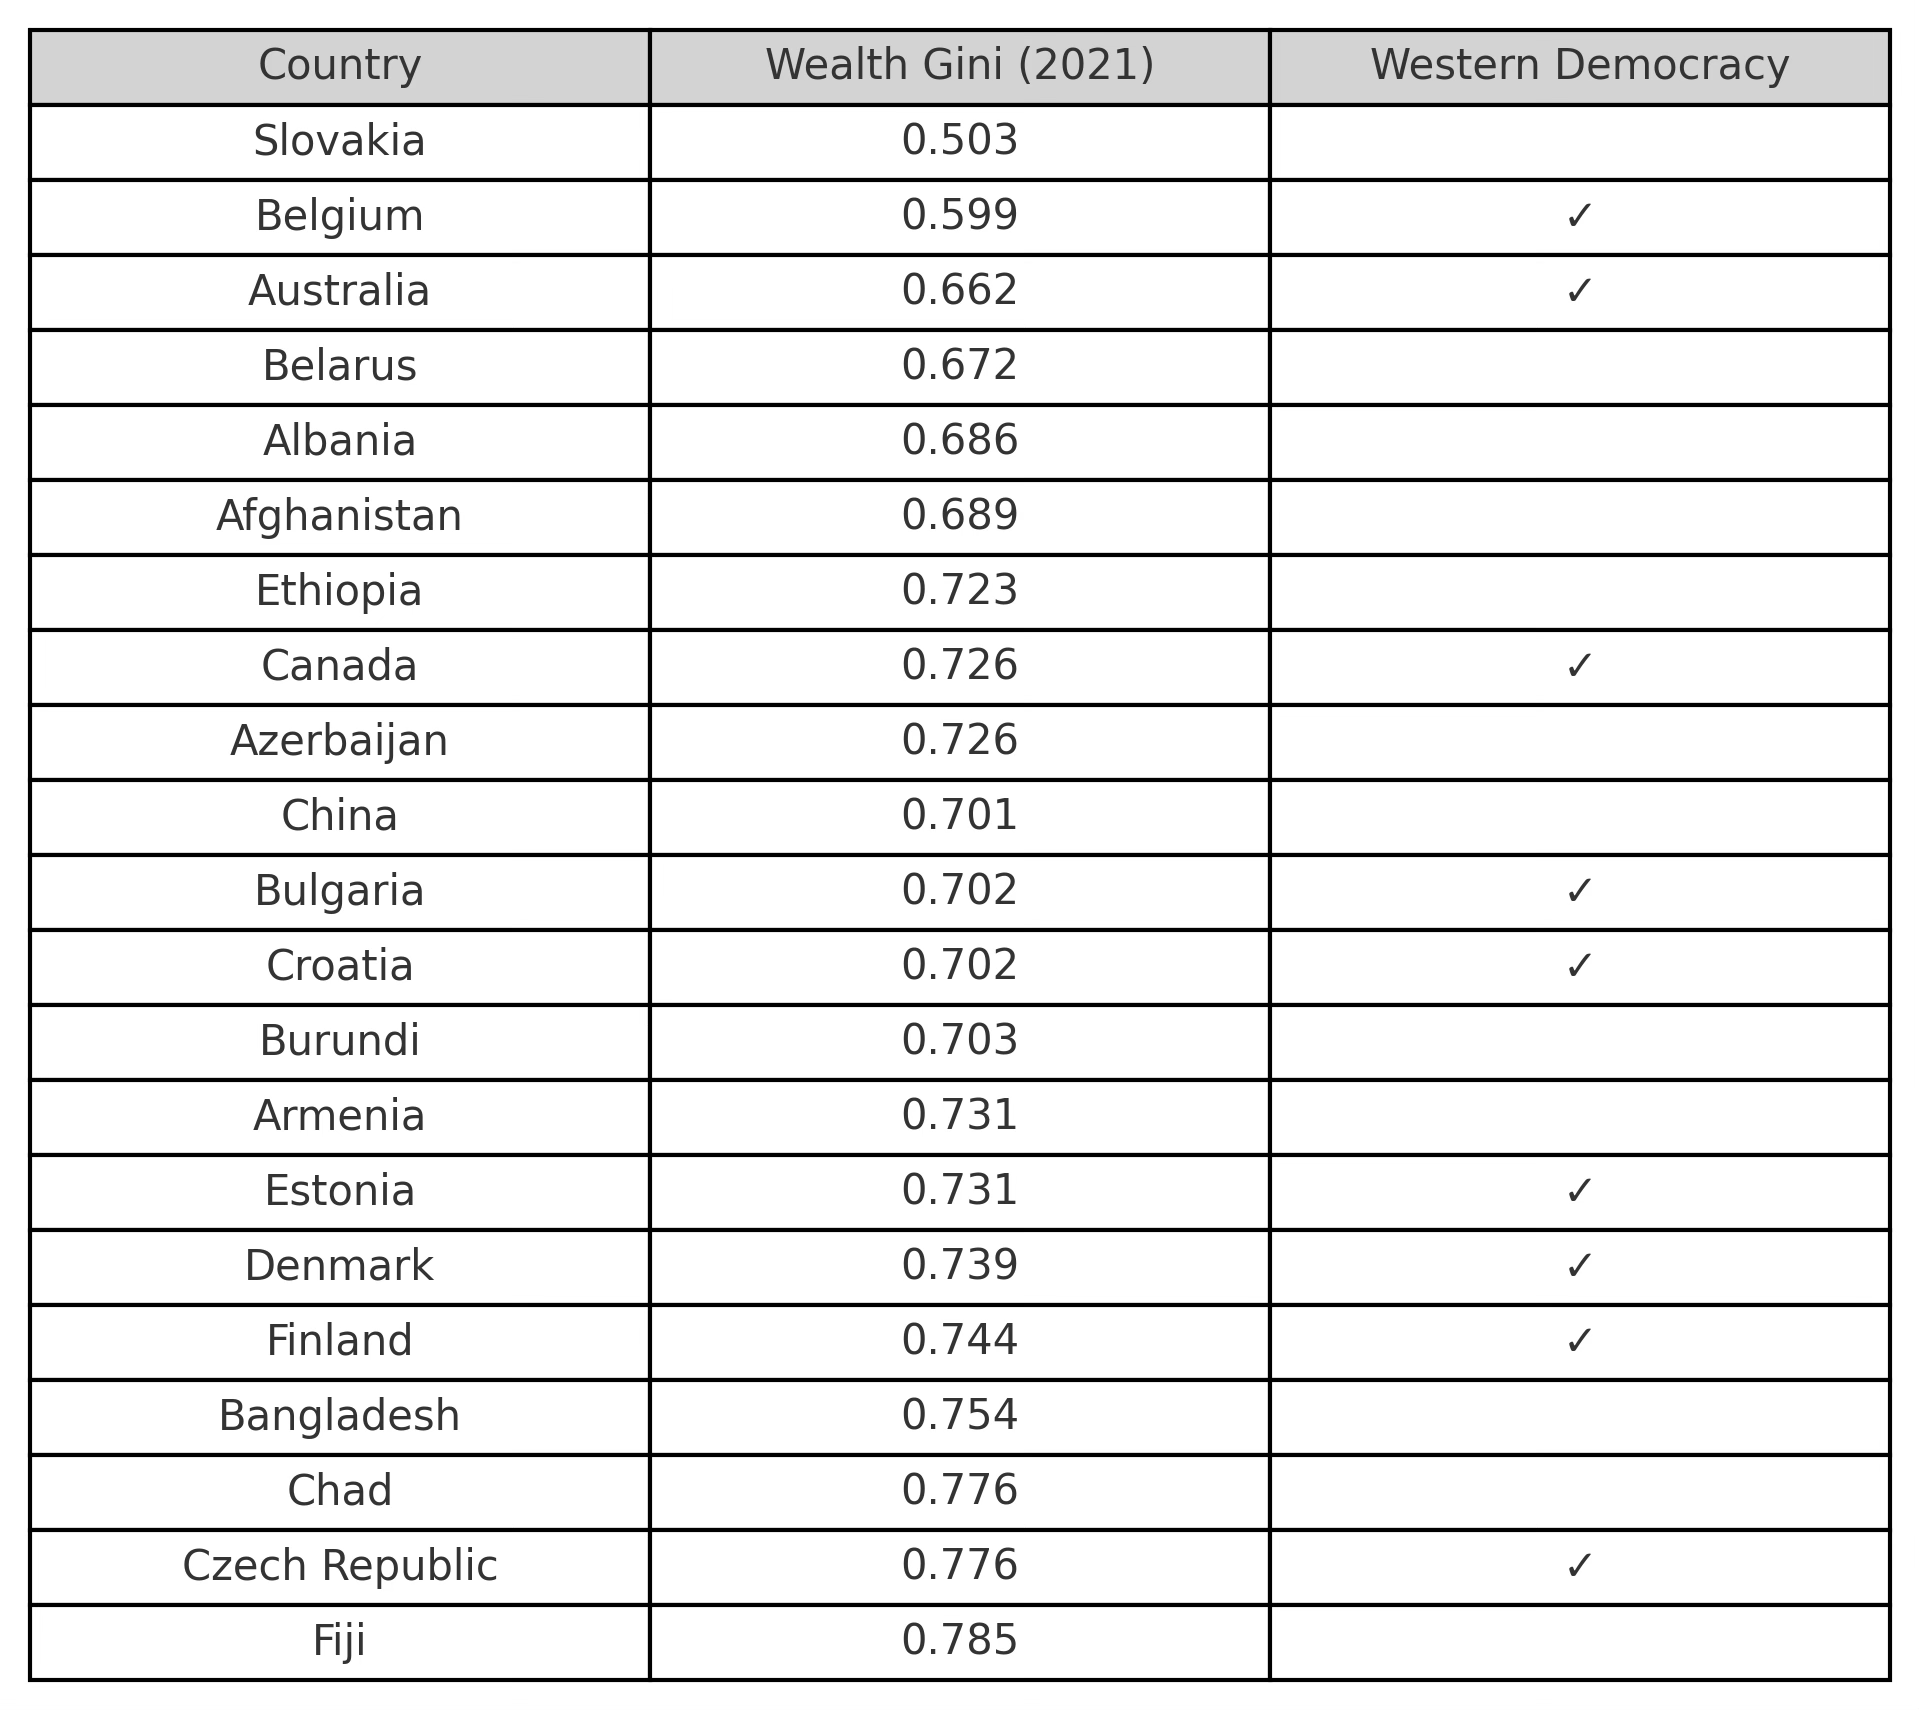
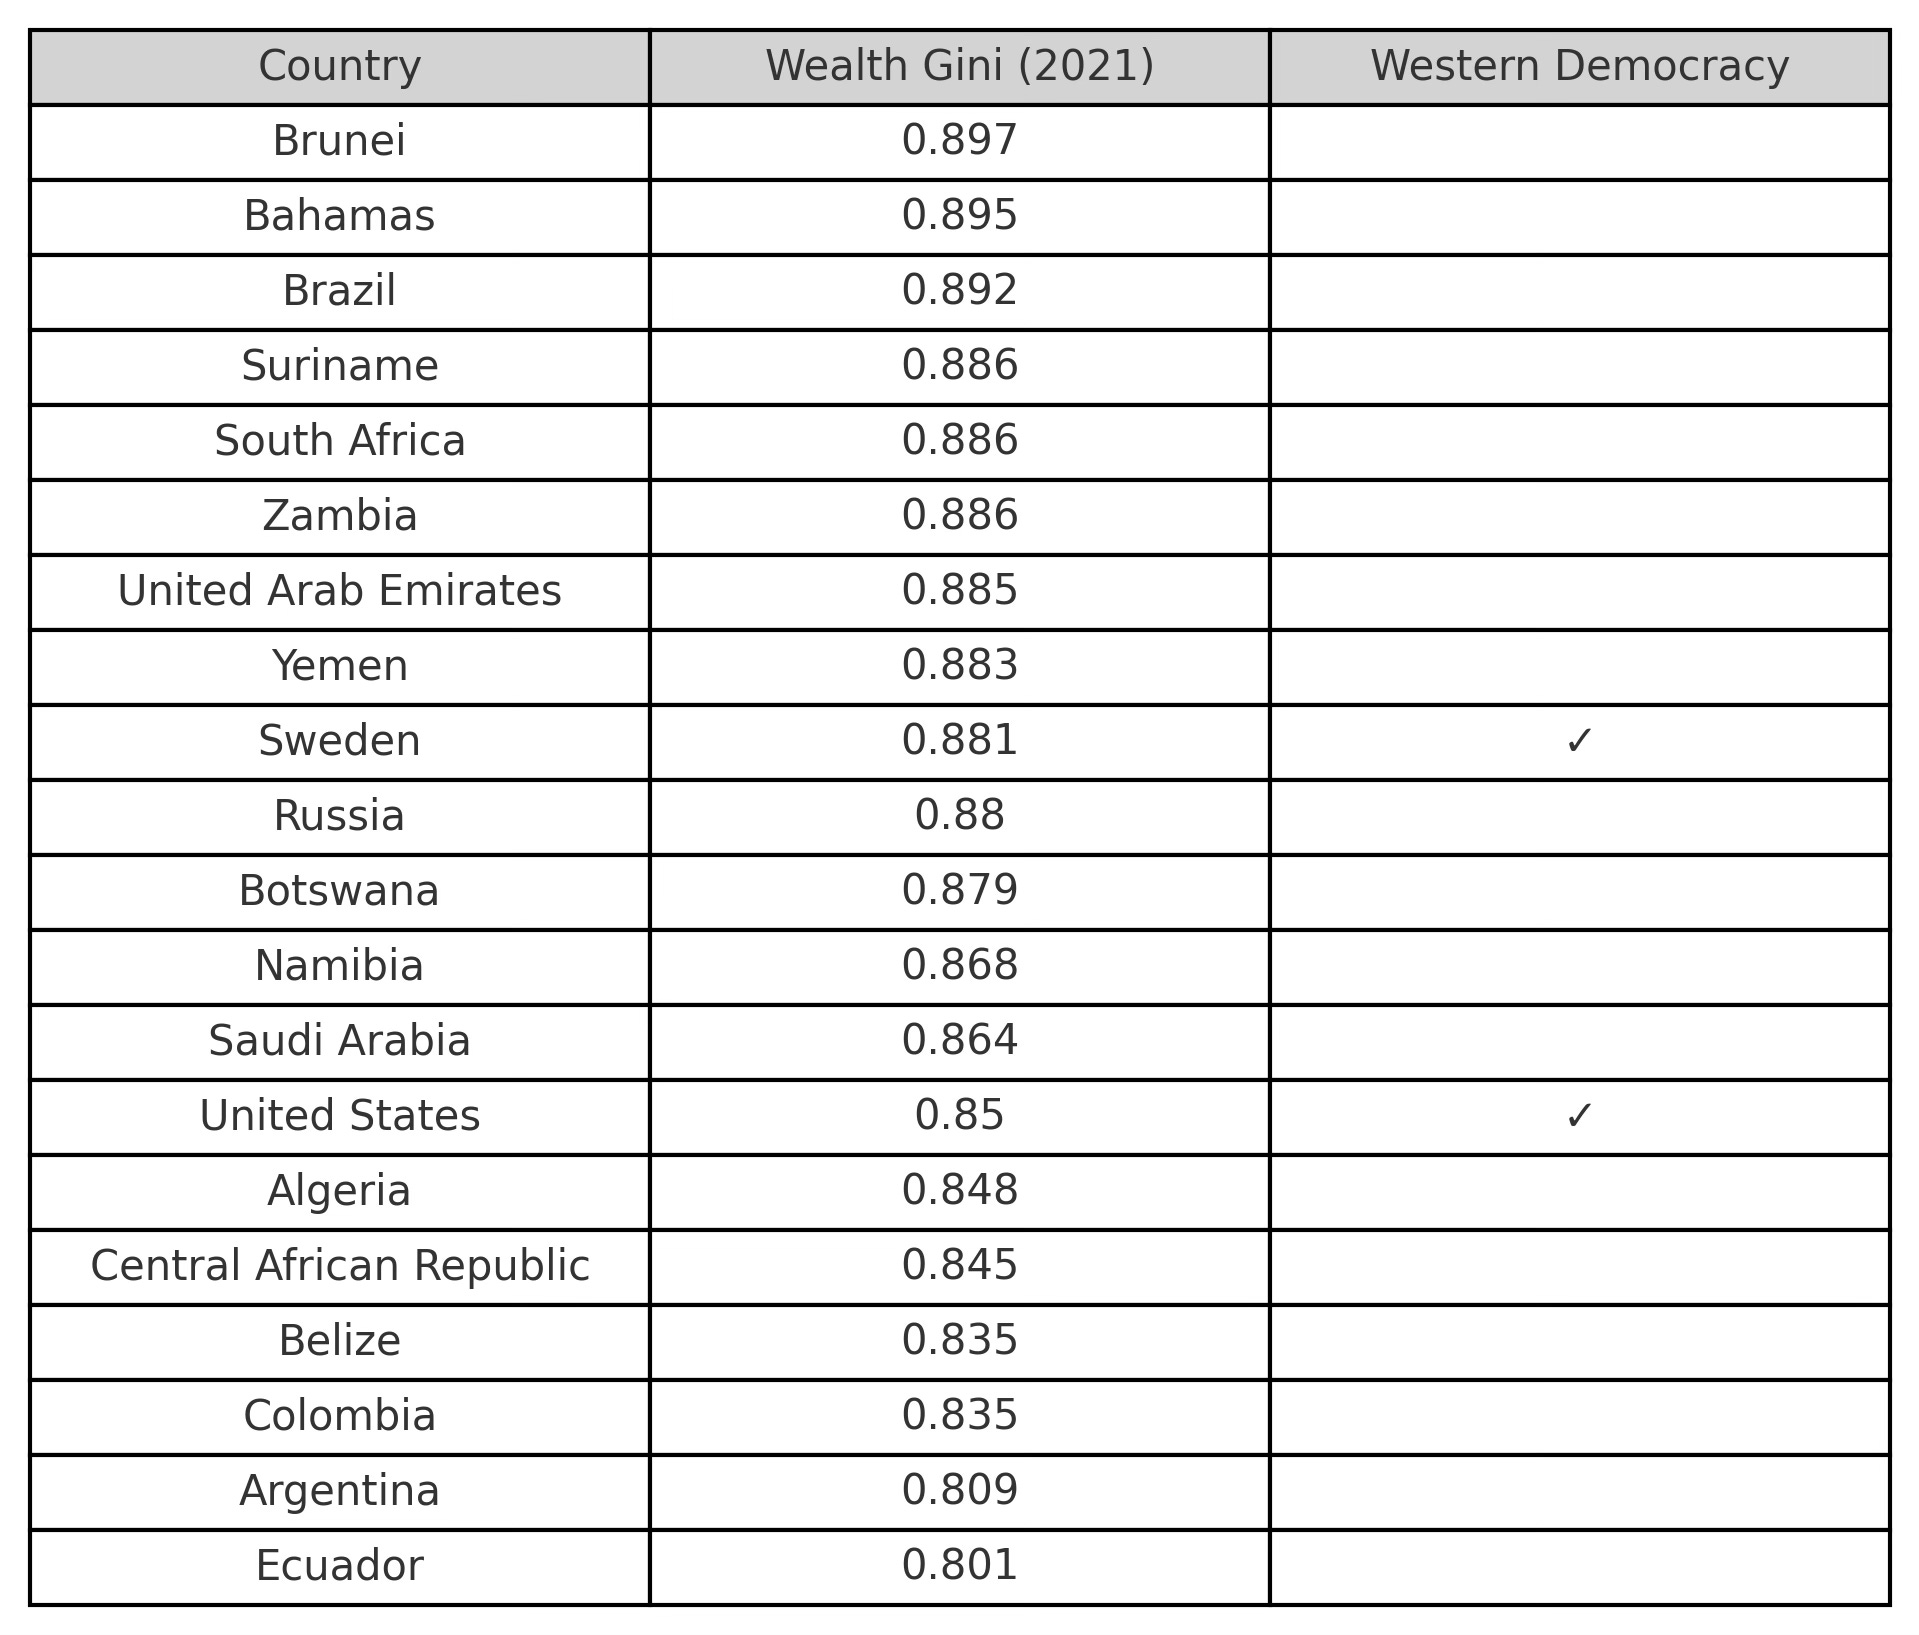
You will notice something here, America does not even make the top 20, Slovakia has the best wealth distribution in the world at 50.3%, but for our example will use Belgium (60%) as the first of the western democracies. Compared that with America at 83%. So while the US is the wealthiest country, we are not distributing it well through our citizens. In fact we rank 14th of the worst nations.
Comparing Belgium to America:
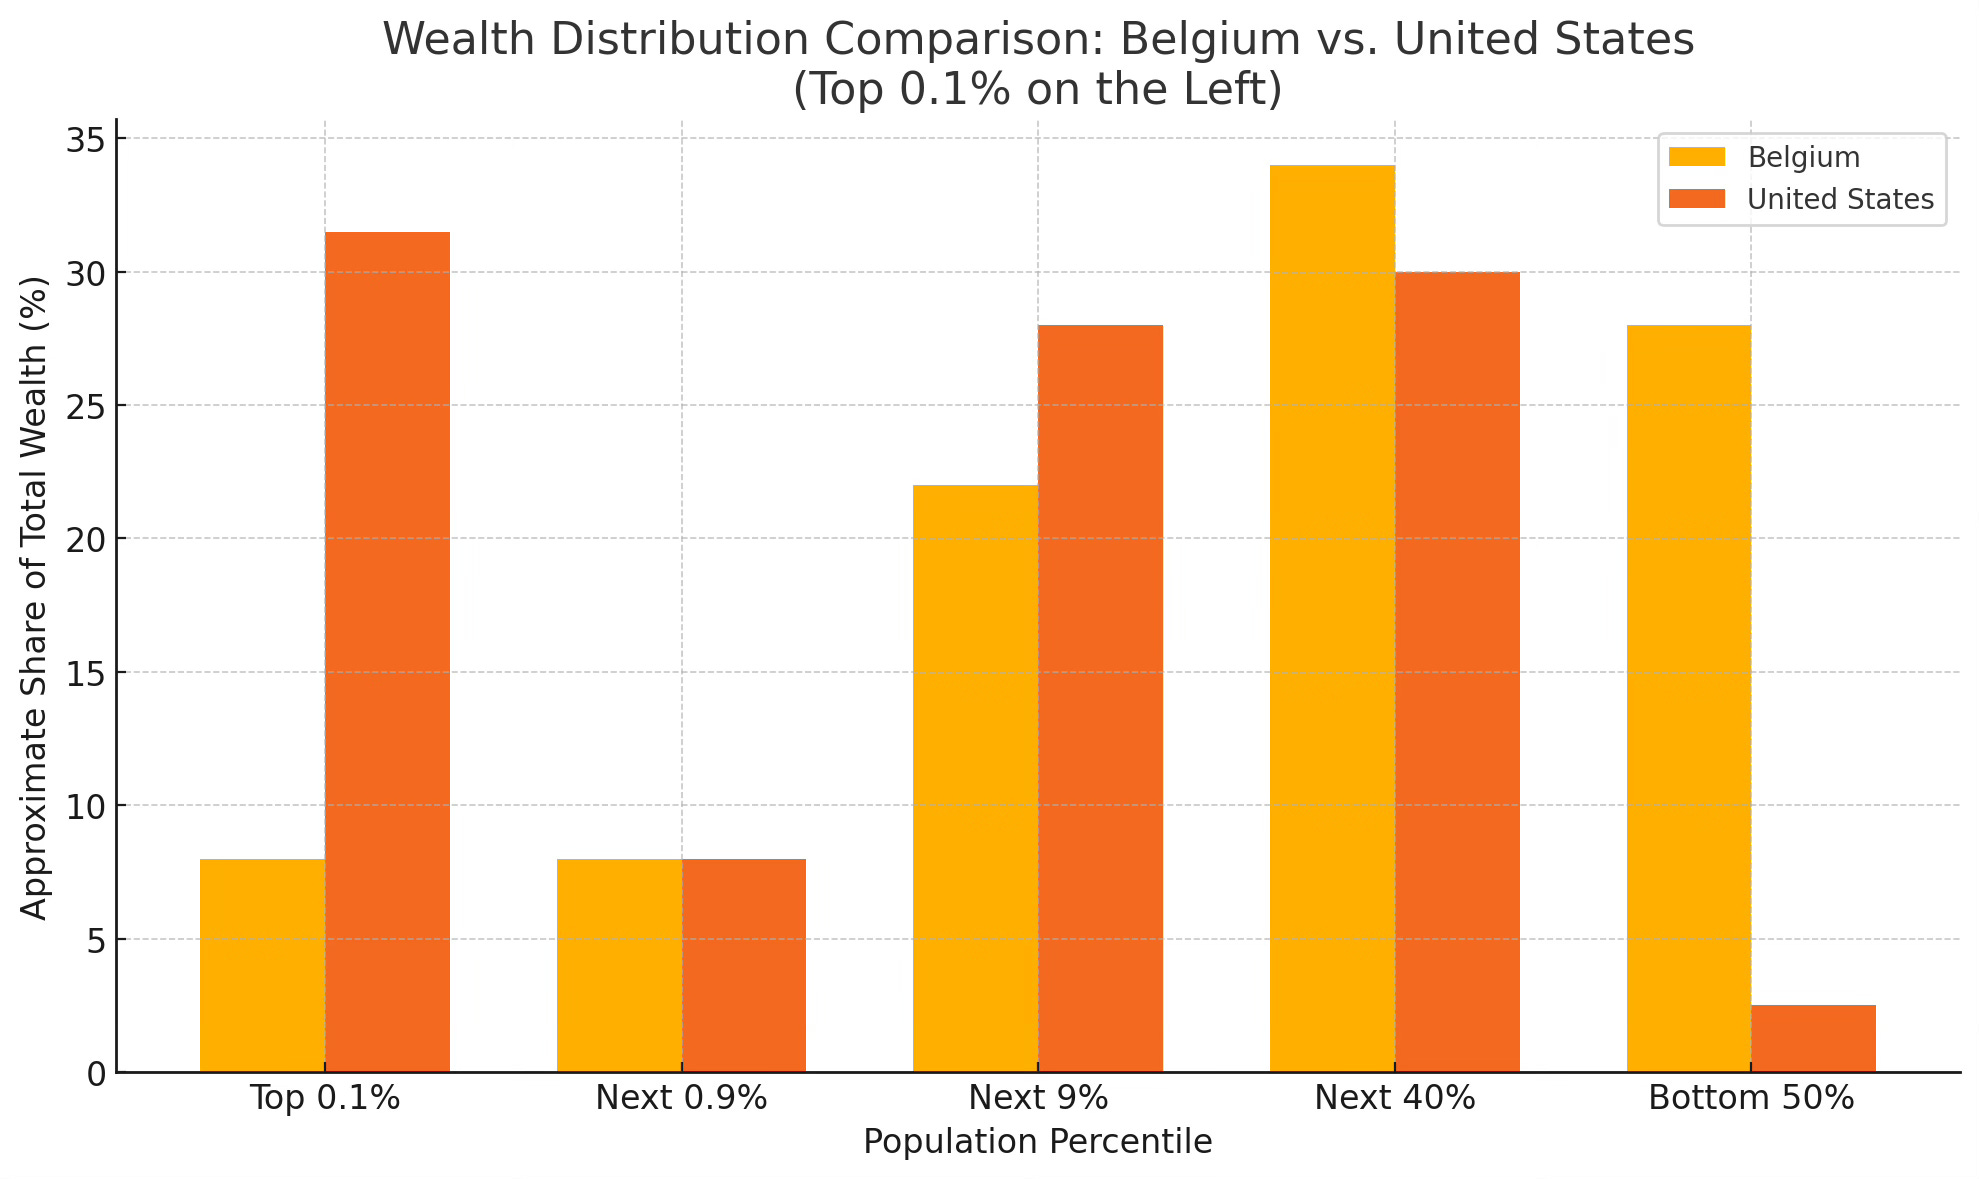
You can clearly see here that they have a better distribution that matches the population in comparison to the US.
Let’s get back to our Best Period
Here’s a set of forward-thinking policy ideas grounded in the 1958 tax code principles, but modernized to fit today's economy. These includes strategic tax reforms and budget realignments, all with the goals of growing the middle class, increasing wealth share of the working class and lowering the national debt.
1968 is roughly the most egalitarian, while the Top .1% bottomed out around 1978 with their wealth share only being 7% compared to now at 15%. We will be using 1968 at our target.
When the bottom has more, we all do
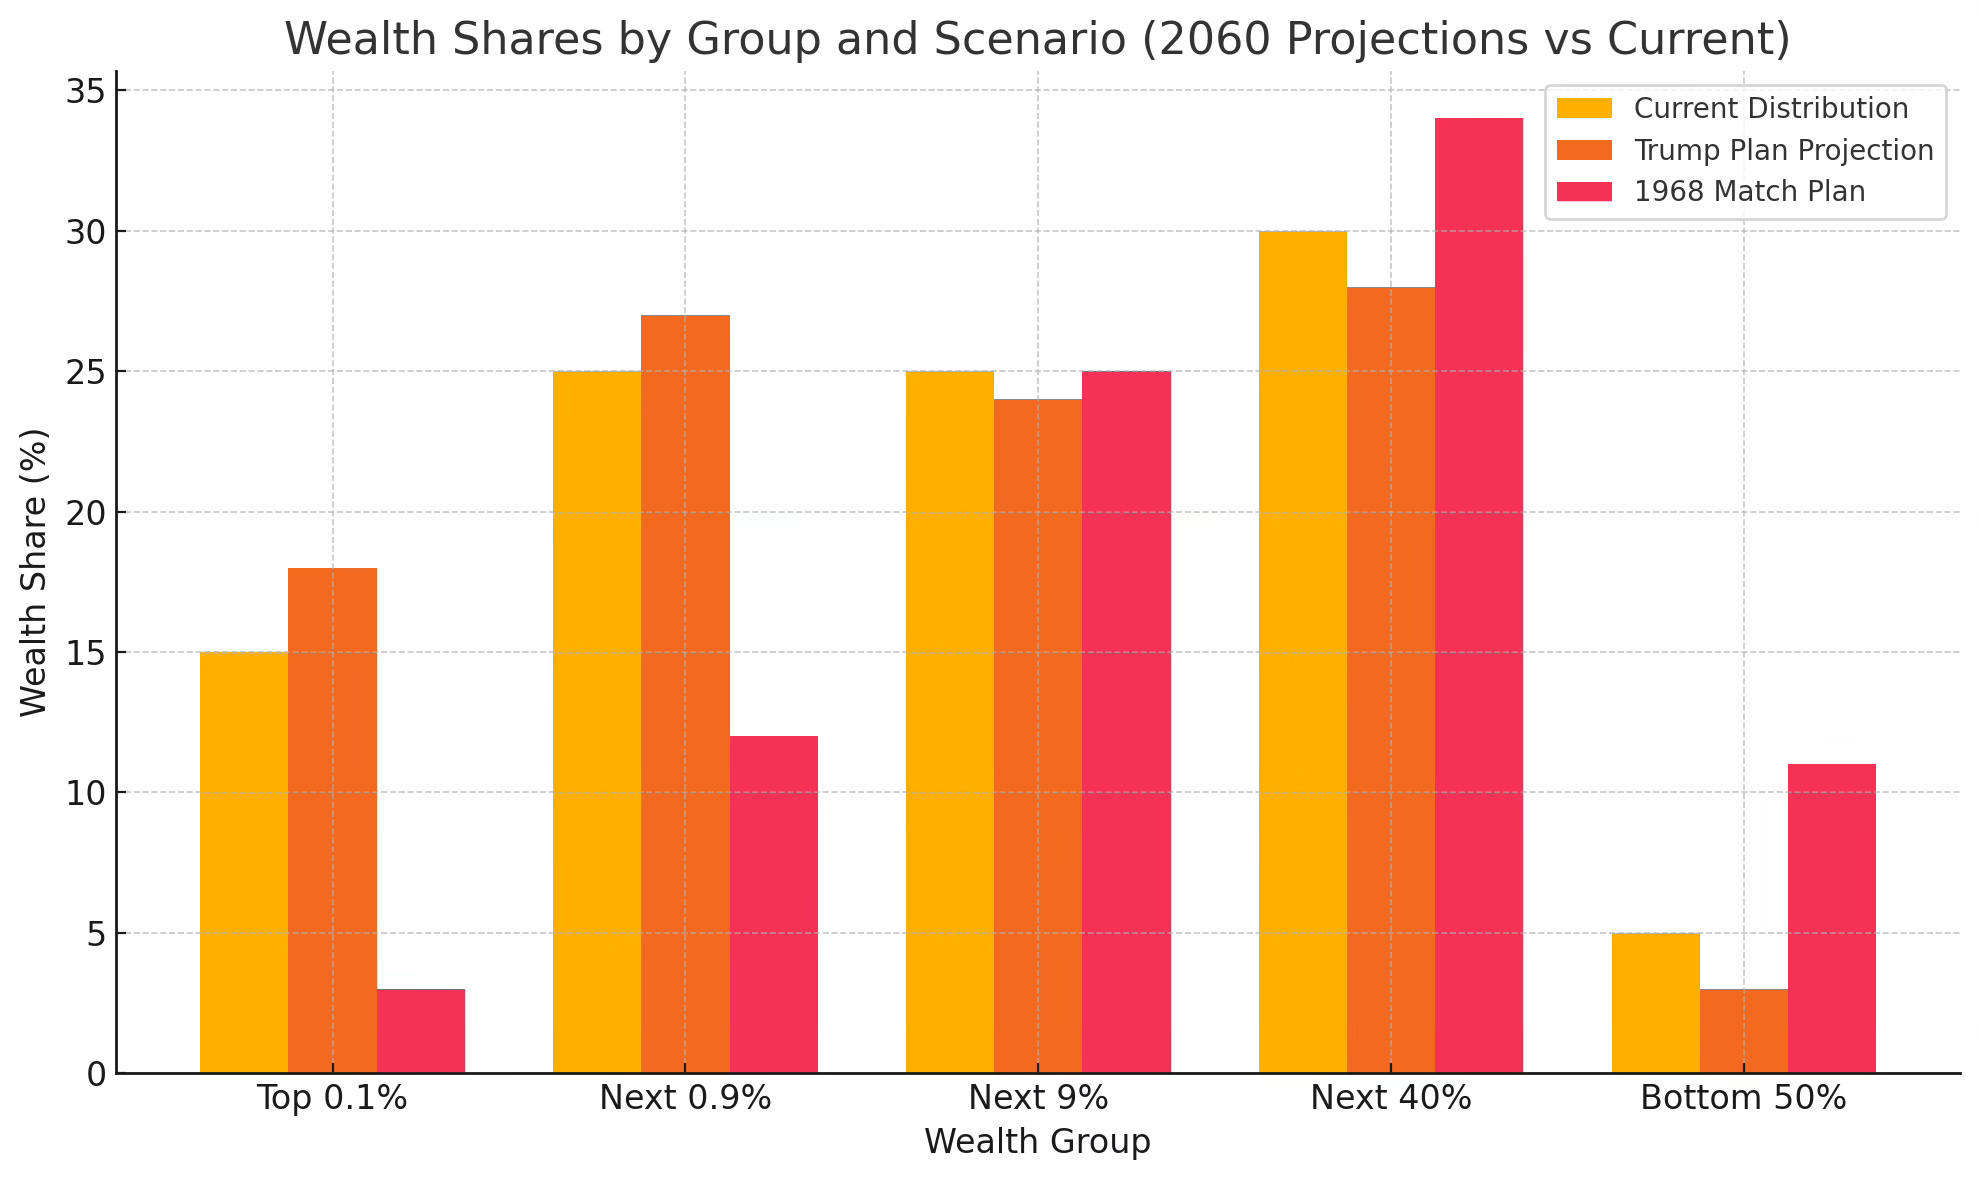
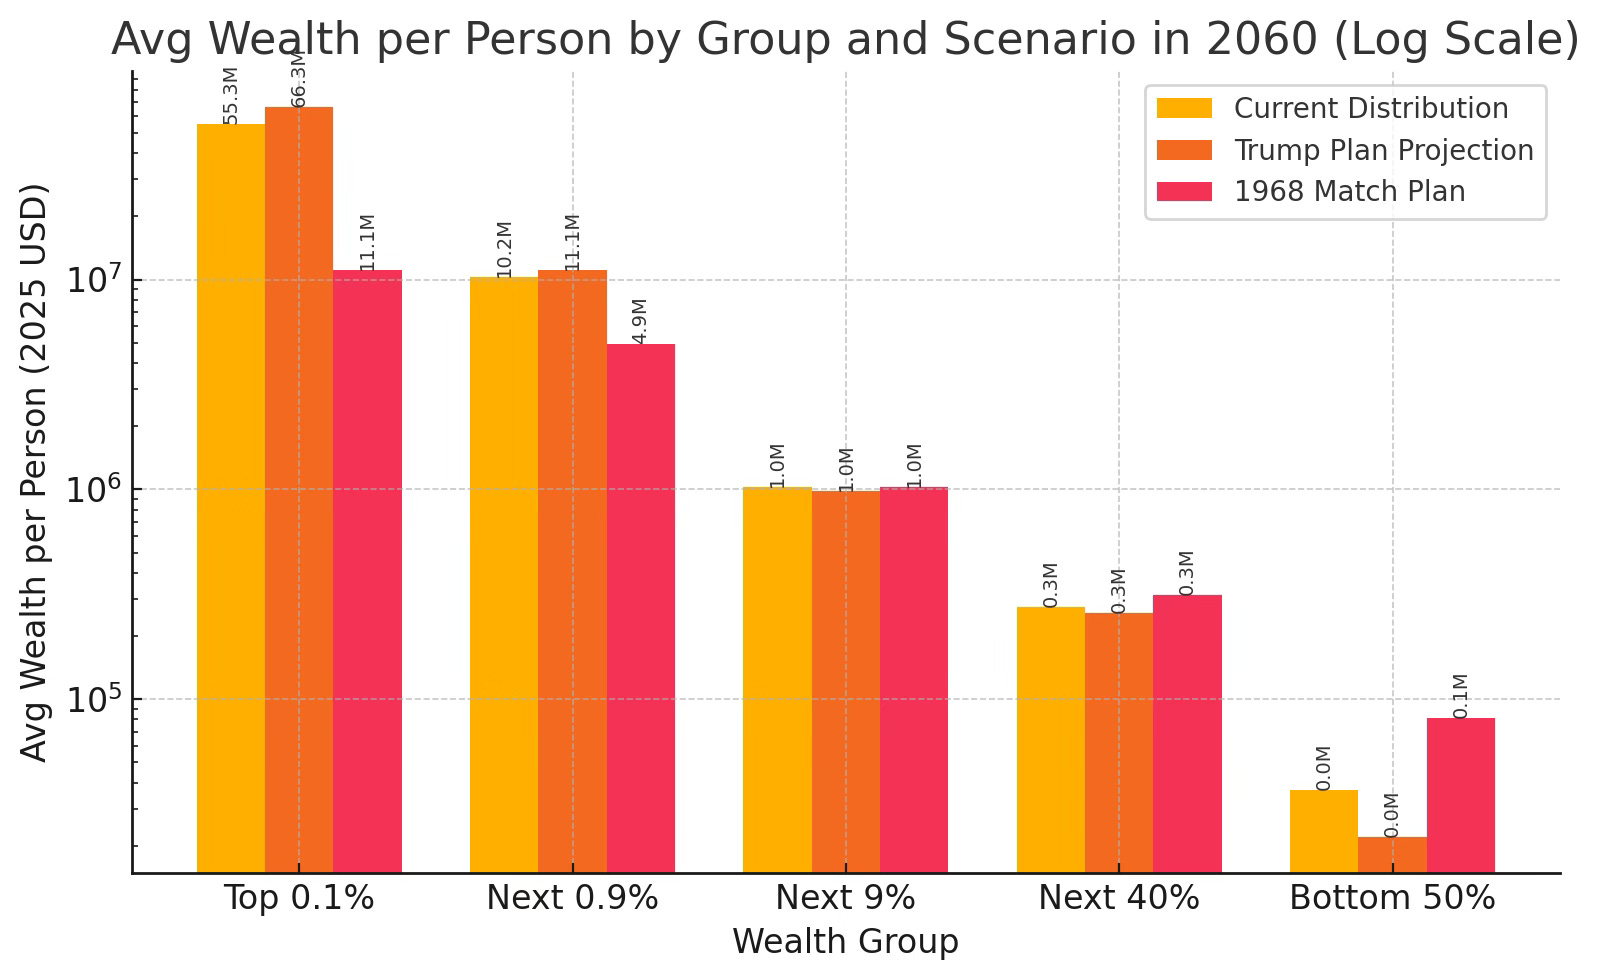
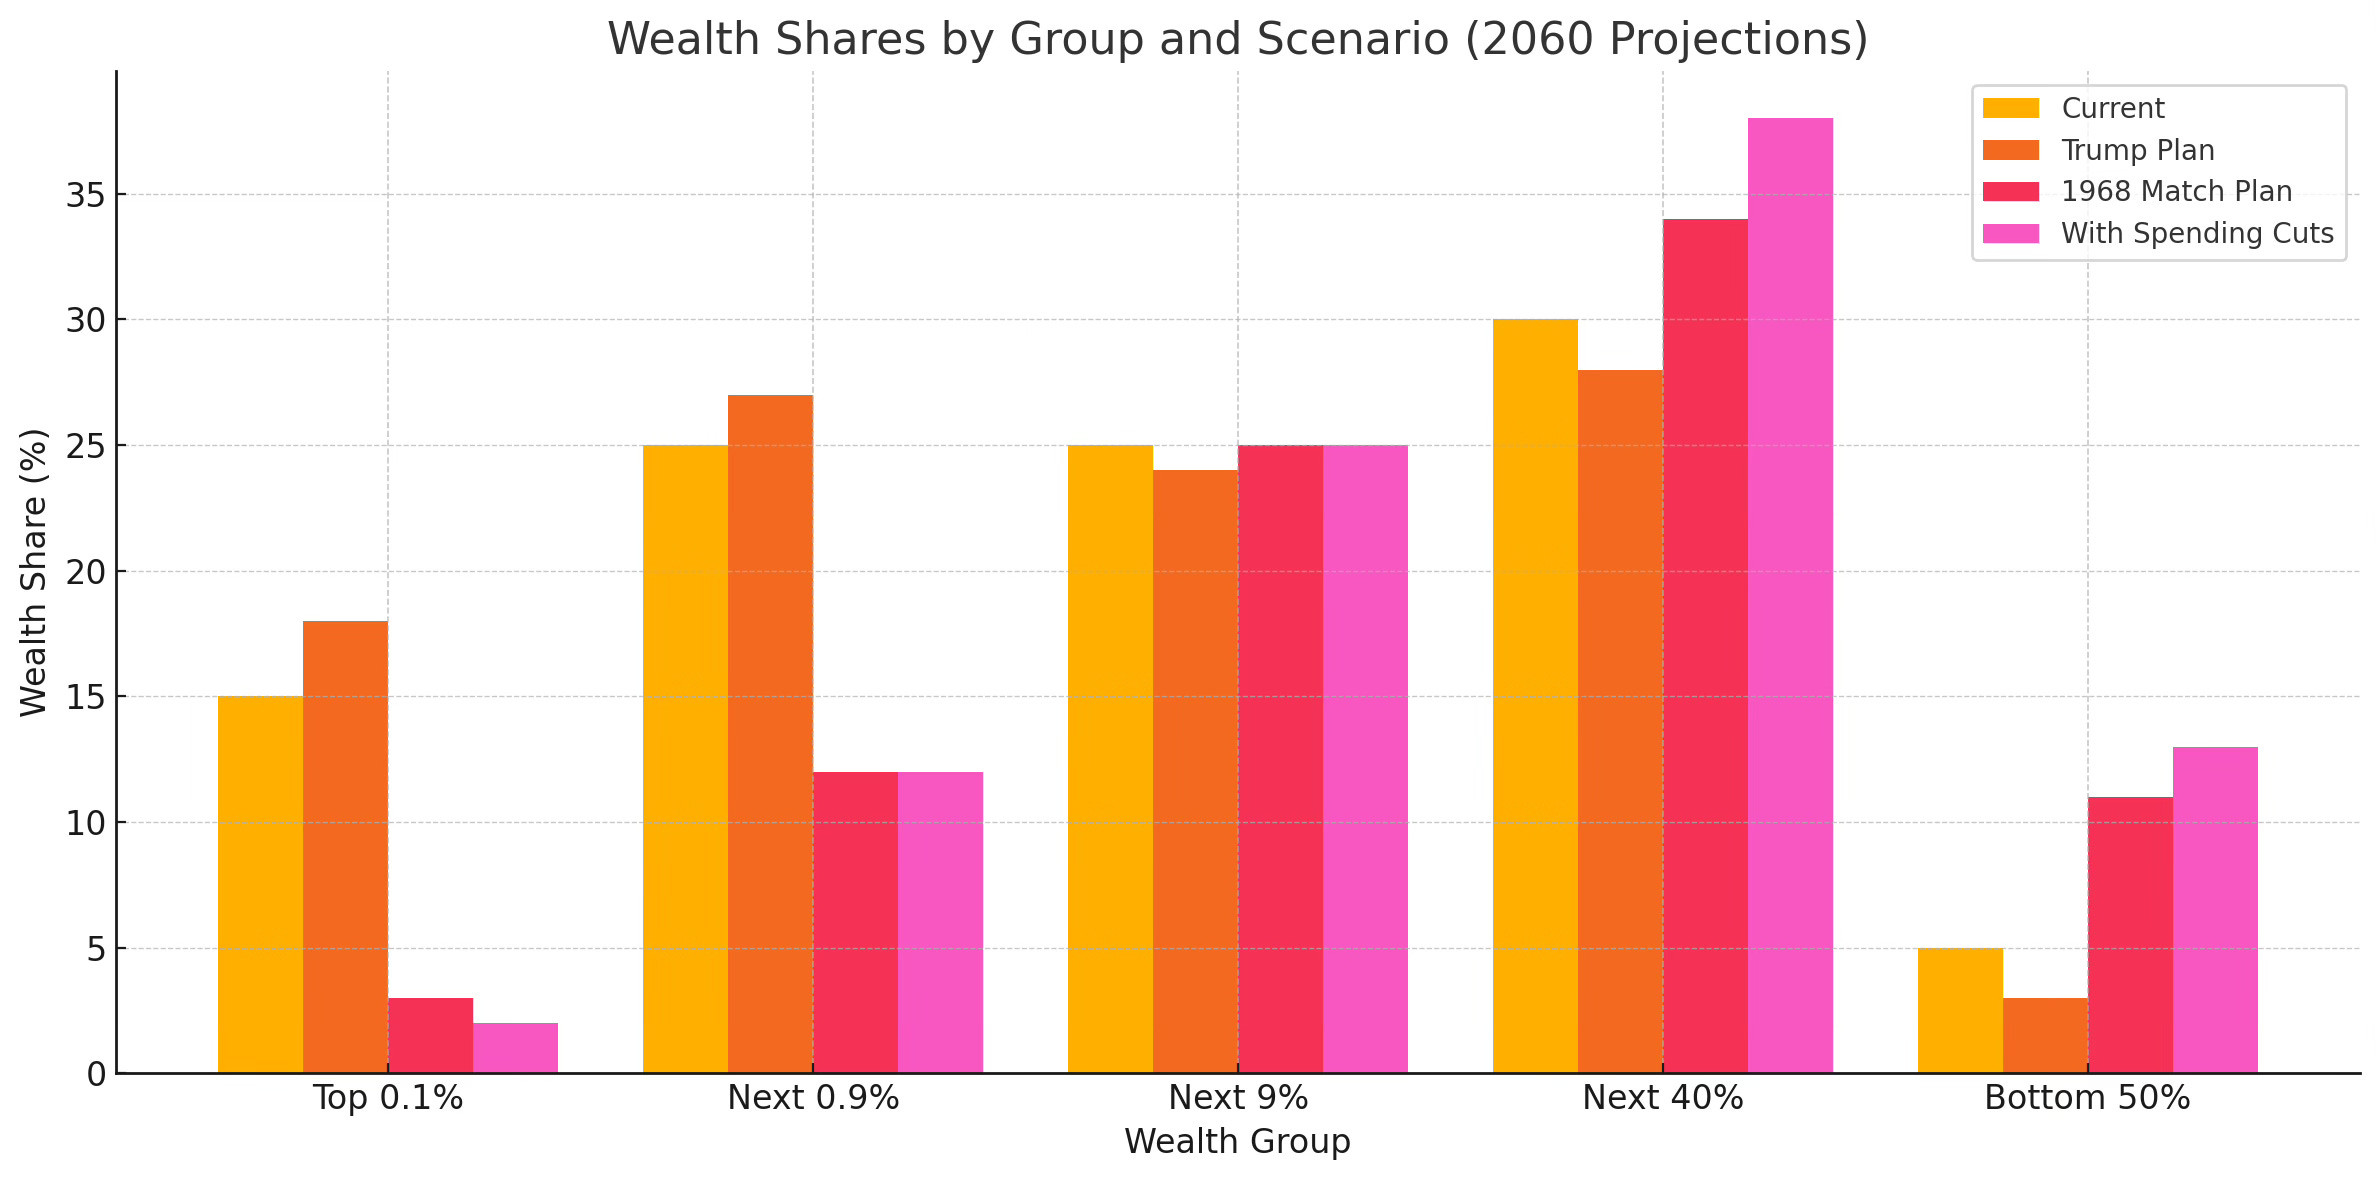
To do this would take a true reimagined set of policies with the goal of increasing GDP by creating more buying power where the largest population groups are by wealth. Using the policies of 1958 we can see by 1968 what the wealth distribution was compared to the current distribution, Trump’s Budget Plan and an Integrated Plan that targets 2060. Our current policies put the most wealth in the top 1% of hands, this lowers the buying power and overall GDP effect. We need to shift this back to what we saw in the boom of the middle class, give more buying power to the biggest group population wise.
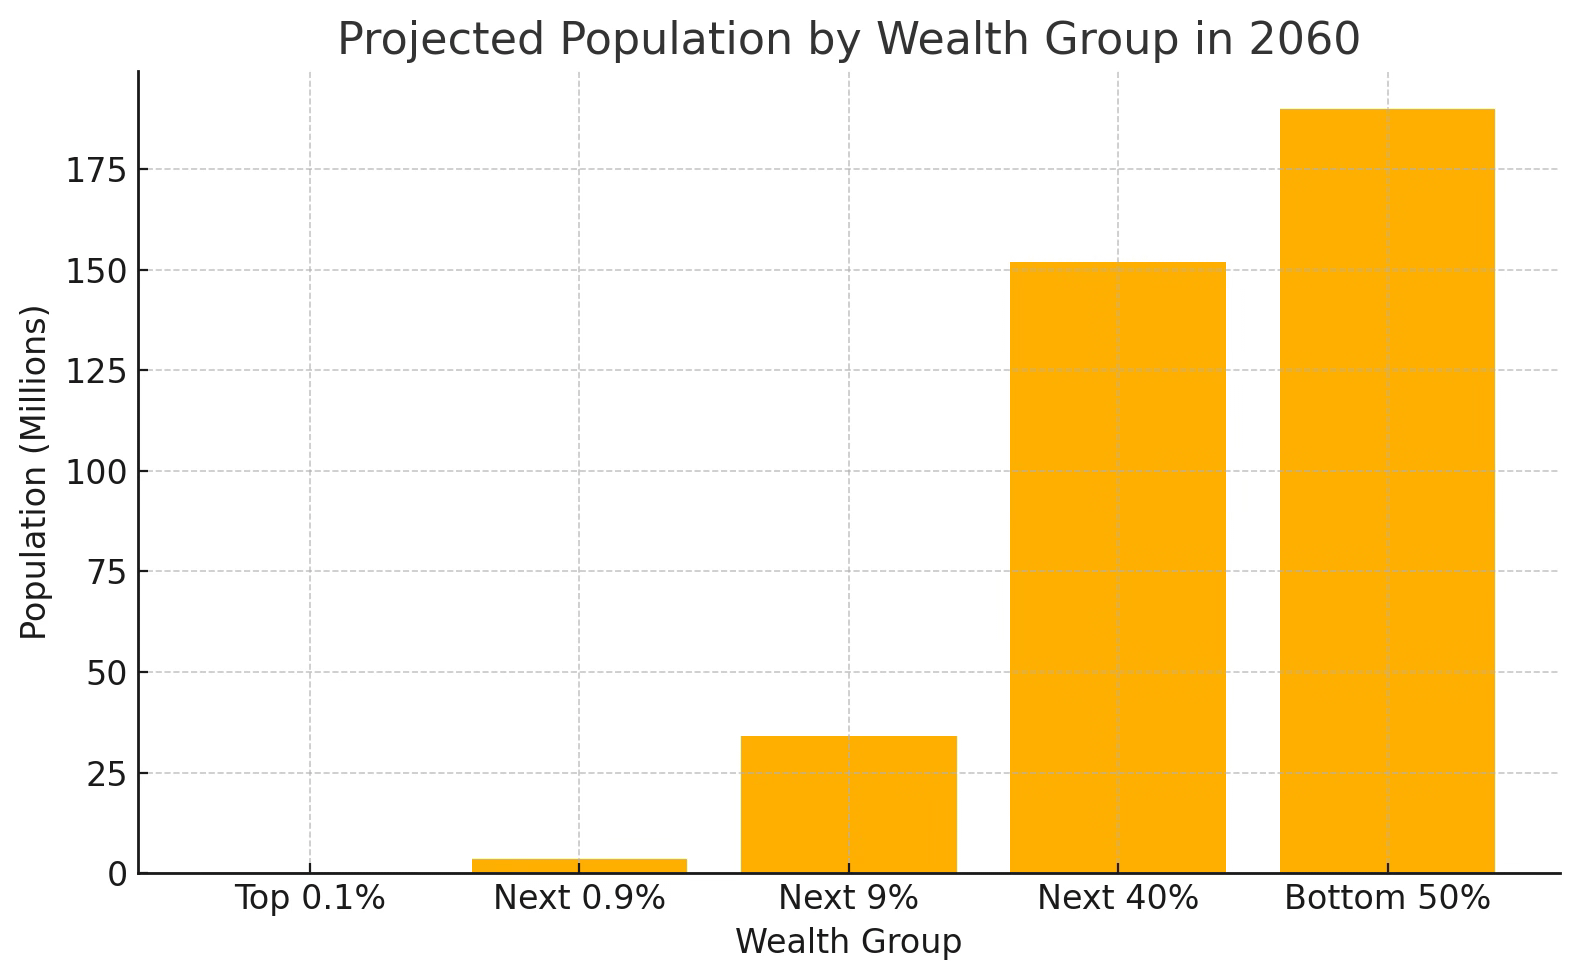
Current Wealth Share:
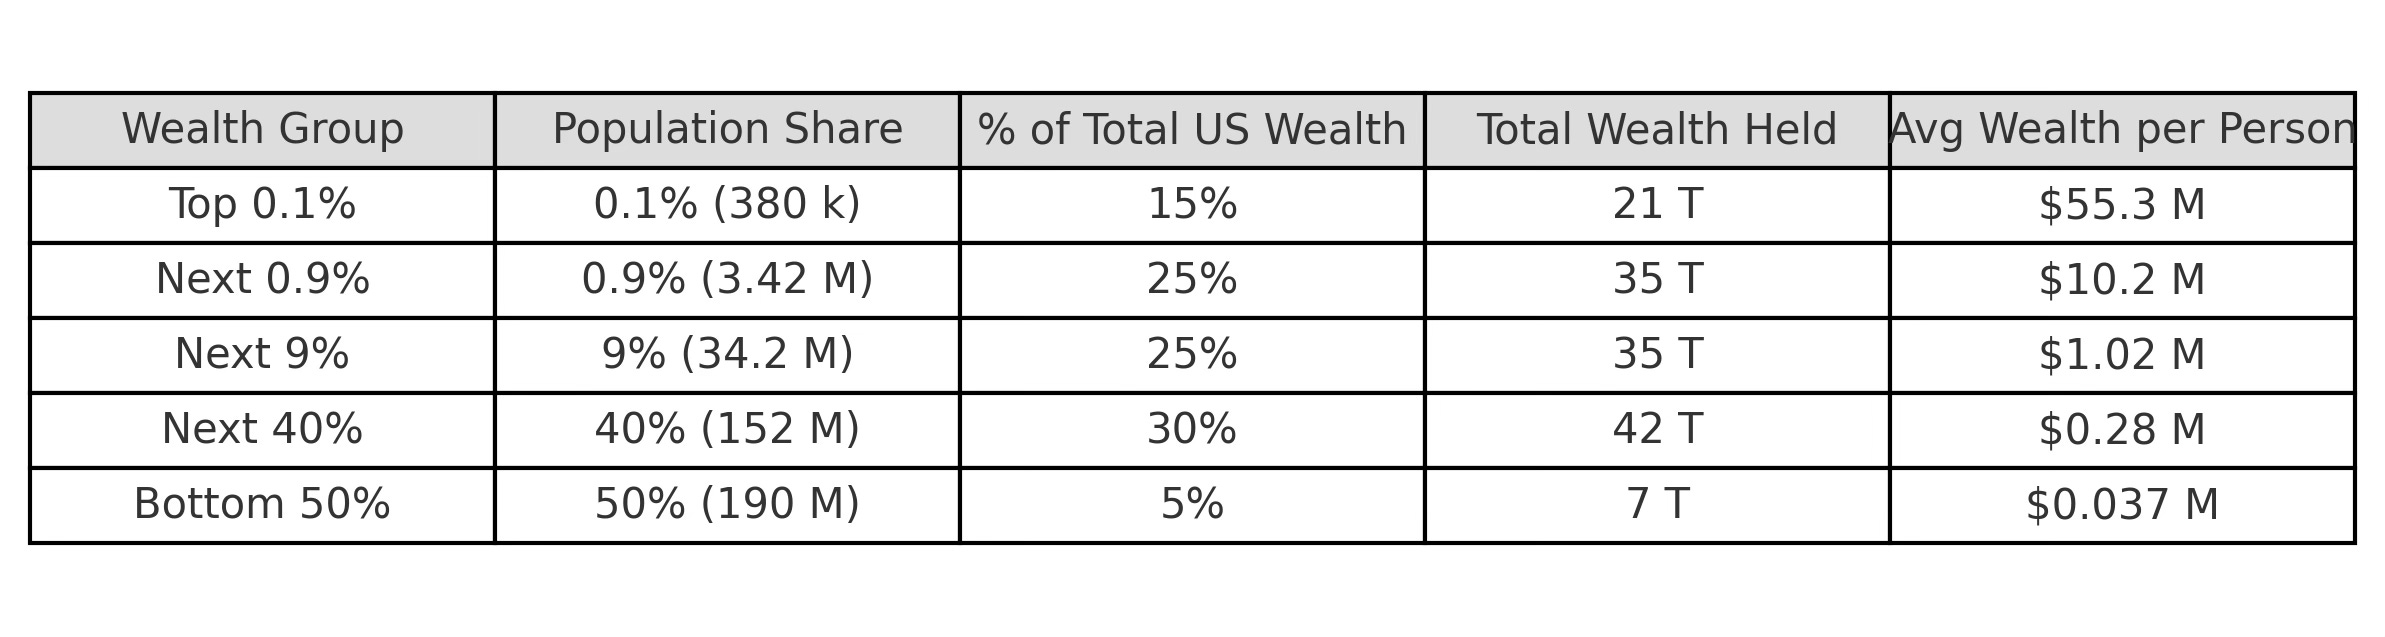
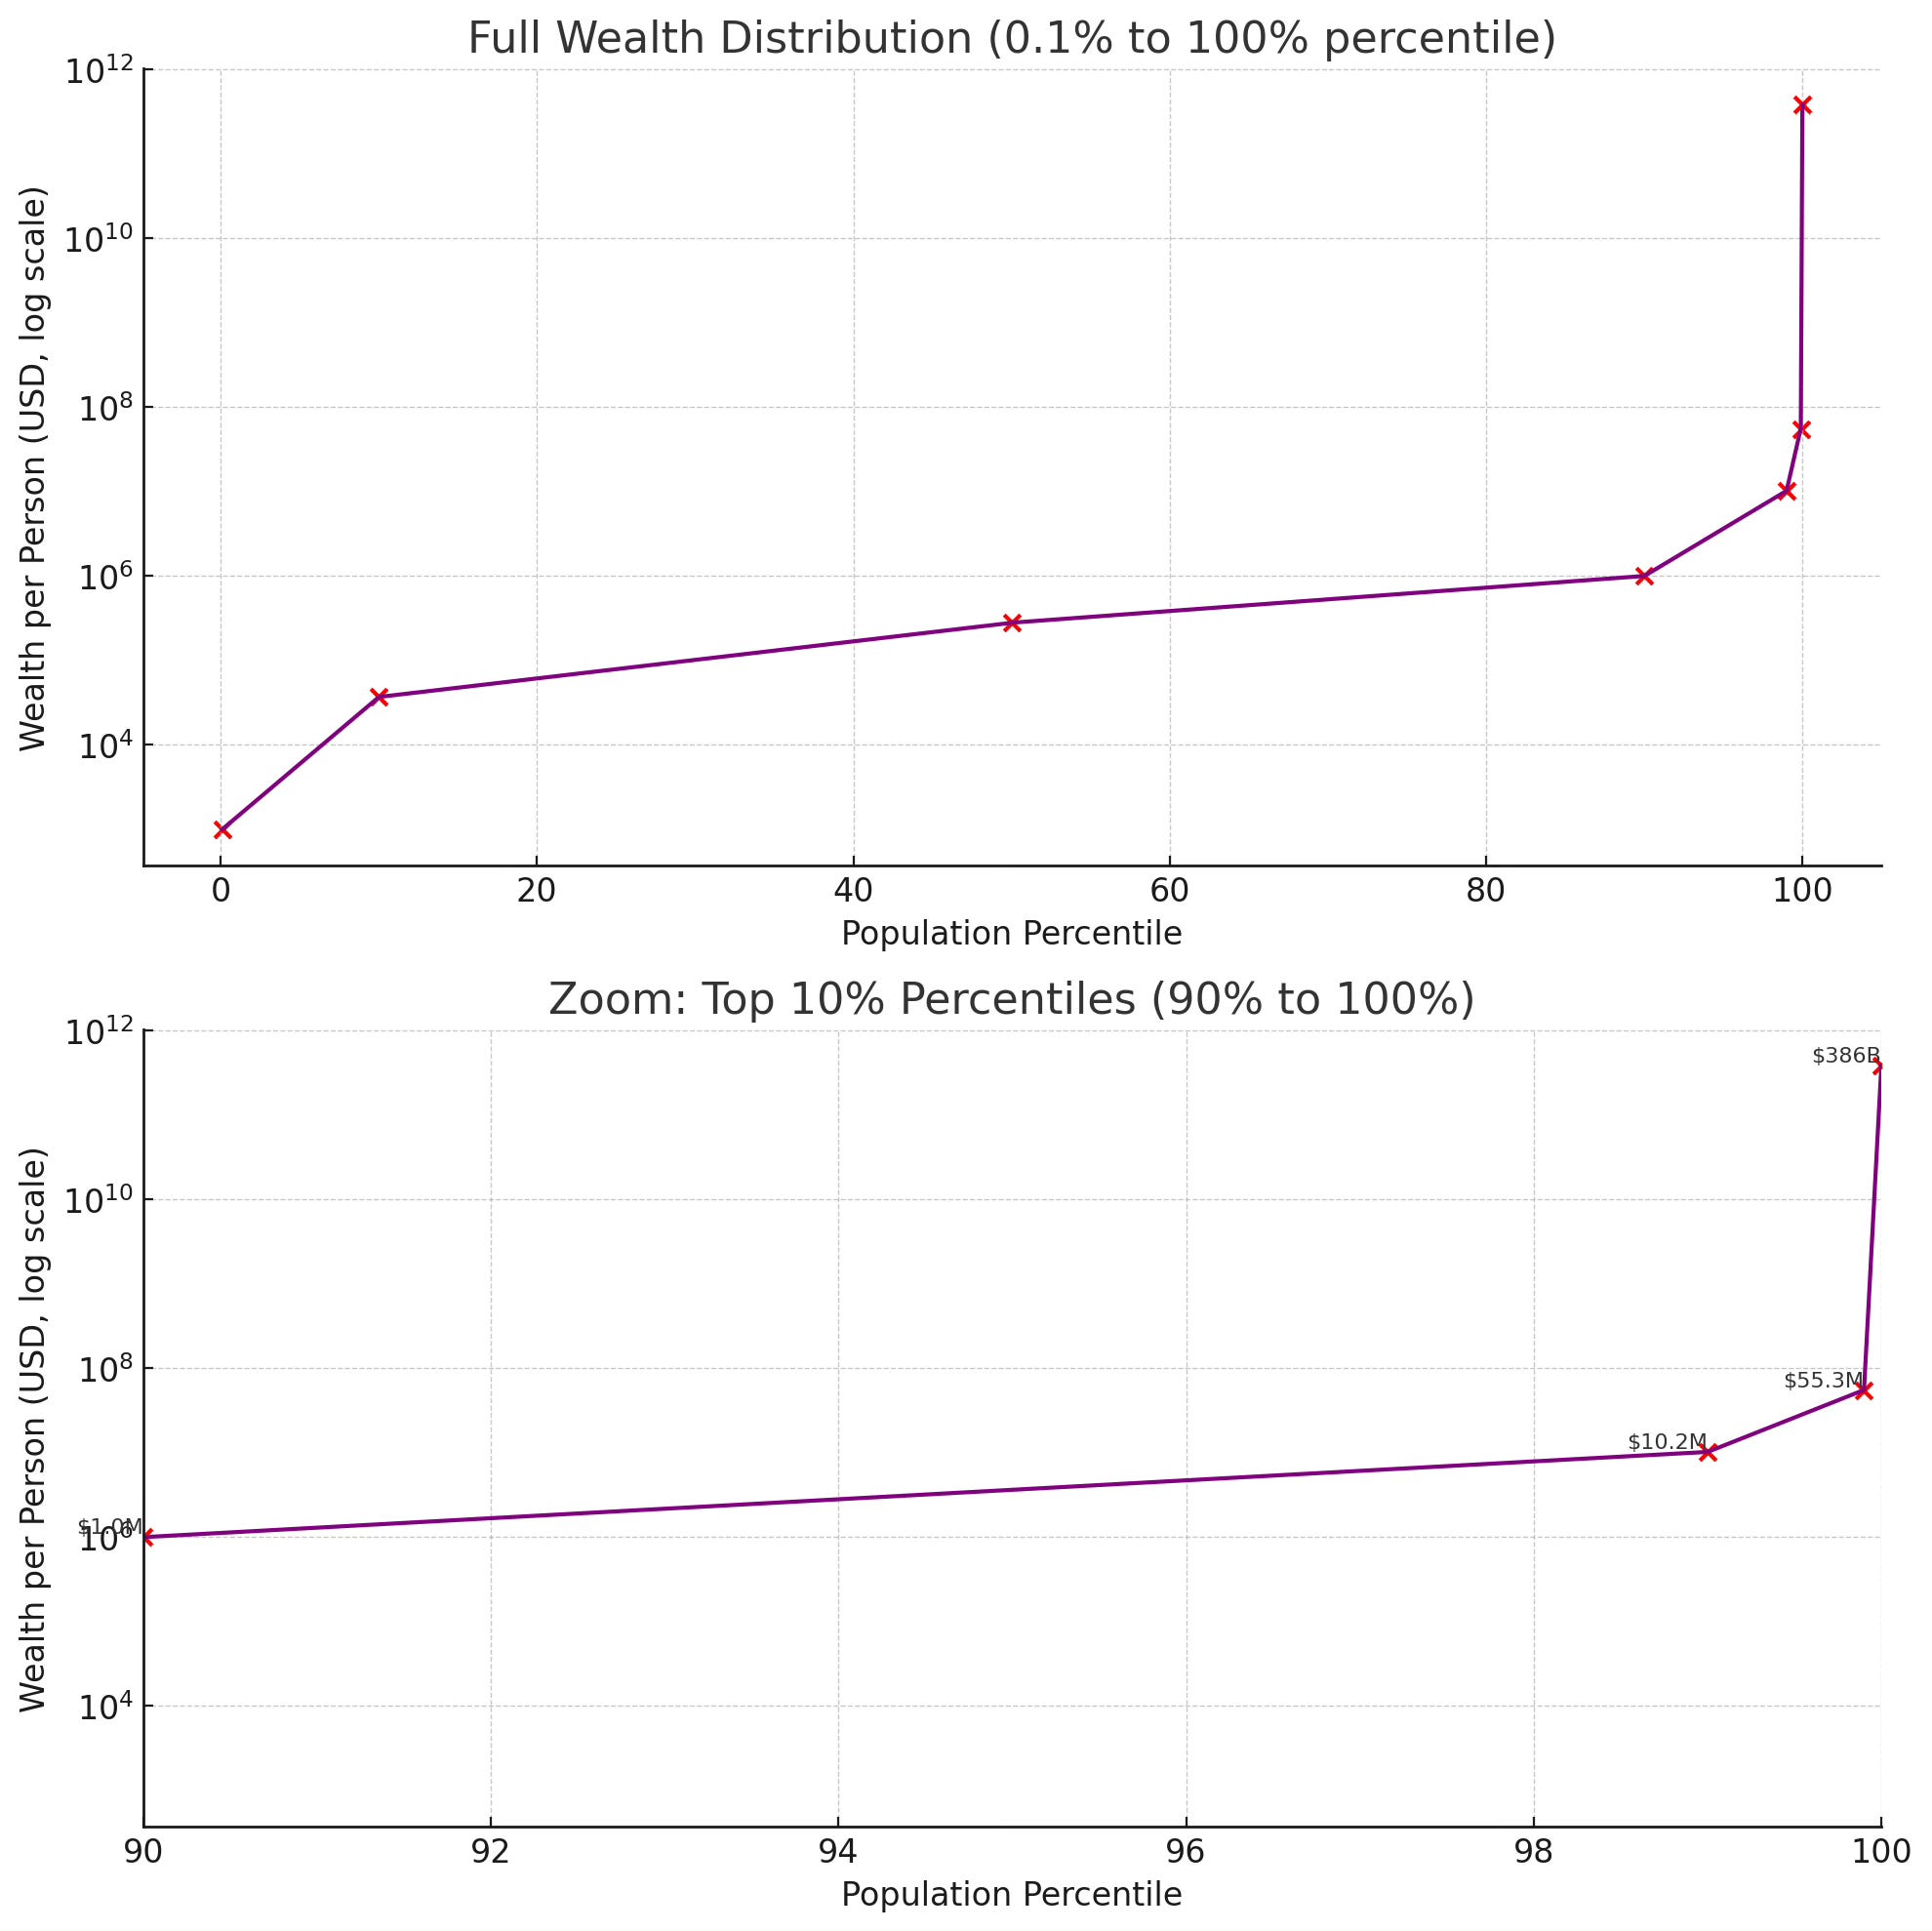
In the current system, 190 million people live with an average total wealth of $37,000 or 5% of the nations wealth. At the top .1%, 380k people have an average wealth of $55.3 million.
Here is an example of how extreme the is, the Top 10 people have an average wealth of $178.2 billion! And there is one at $368 billion!
1968 Target
Objective: Restore U.S. household wealth shares to their 1968 proportions by 2060 through a combination of modernized taxation, strategic public investment, co‑investment mechanisms, and built‑in adjustment triggers. It’s going to be rough, but without it our debit grows and wealth inequality continues to get worse.
The 1968 Match Plan
Key pillars:
Modernized Progressive Taxes: Deeply progressive income, capital-gains parity, net-wealth, and estate taxes to raise redistribution revenue.
Public Investment & Co-Investment: Ring-fenced funds for childcare, education, housing, plus public-private matching, SPVs, and innovation bonds to turbocharge bottom-half asset growth.
Performance-Driven Allocation: A new Central Fiscal Performance Office (CFPO) uses ROI metrics to steer spending toward wealth-building impact for the bottom 50%.
Automatic Adjustment Mechanism: Built-in five-year reviews that ratchet tax rates and wealth levies until real-time SCF data confirm convergence to 1968 targets.
I. Modernized Progressive Income Tax (Married Filing Jointly)
Estimated Fiscal Impact: Raises approximately ~$2.6 trillion annually in additional revenue by 2030, growing with bracket adjustments.
All income ranges below apply to taxpayers filing Married Filing Jointly.
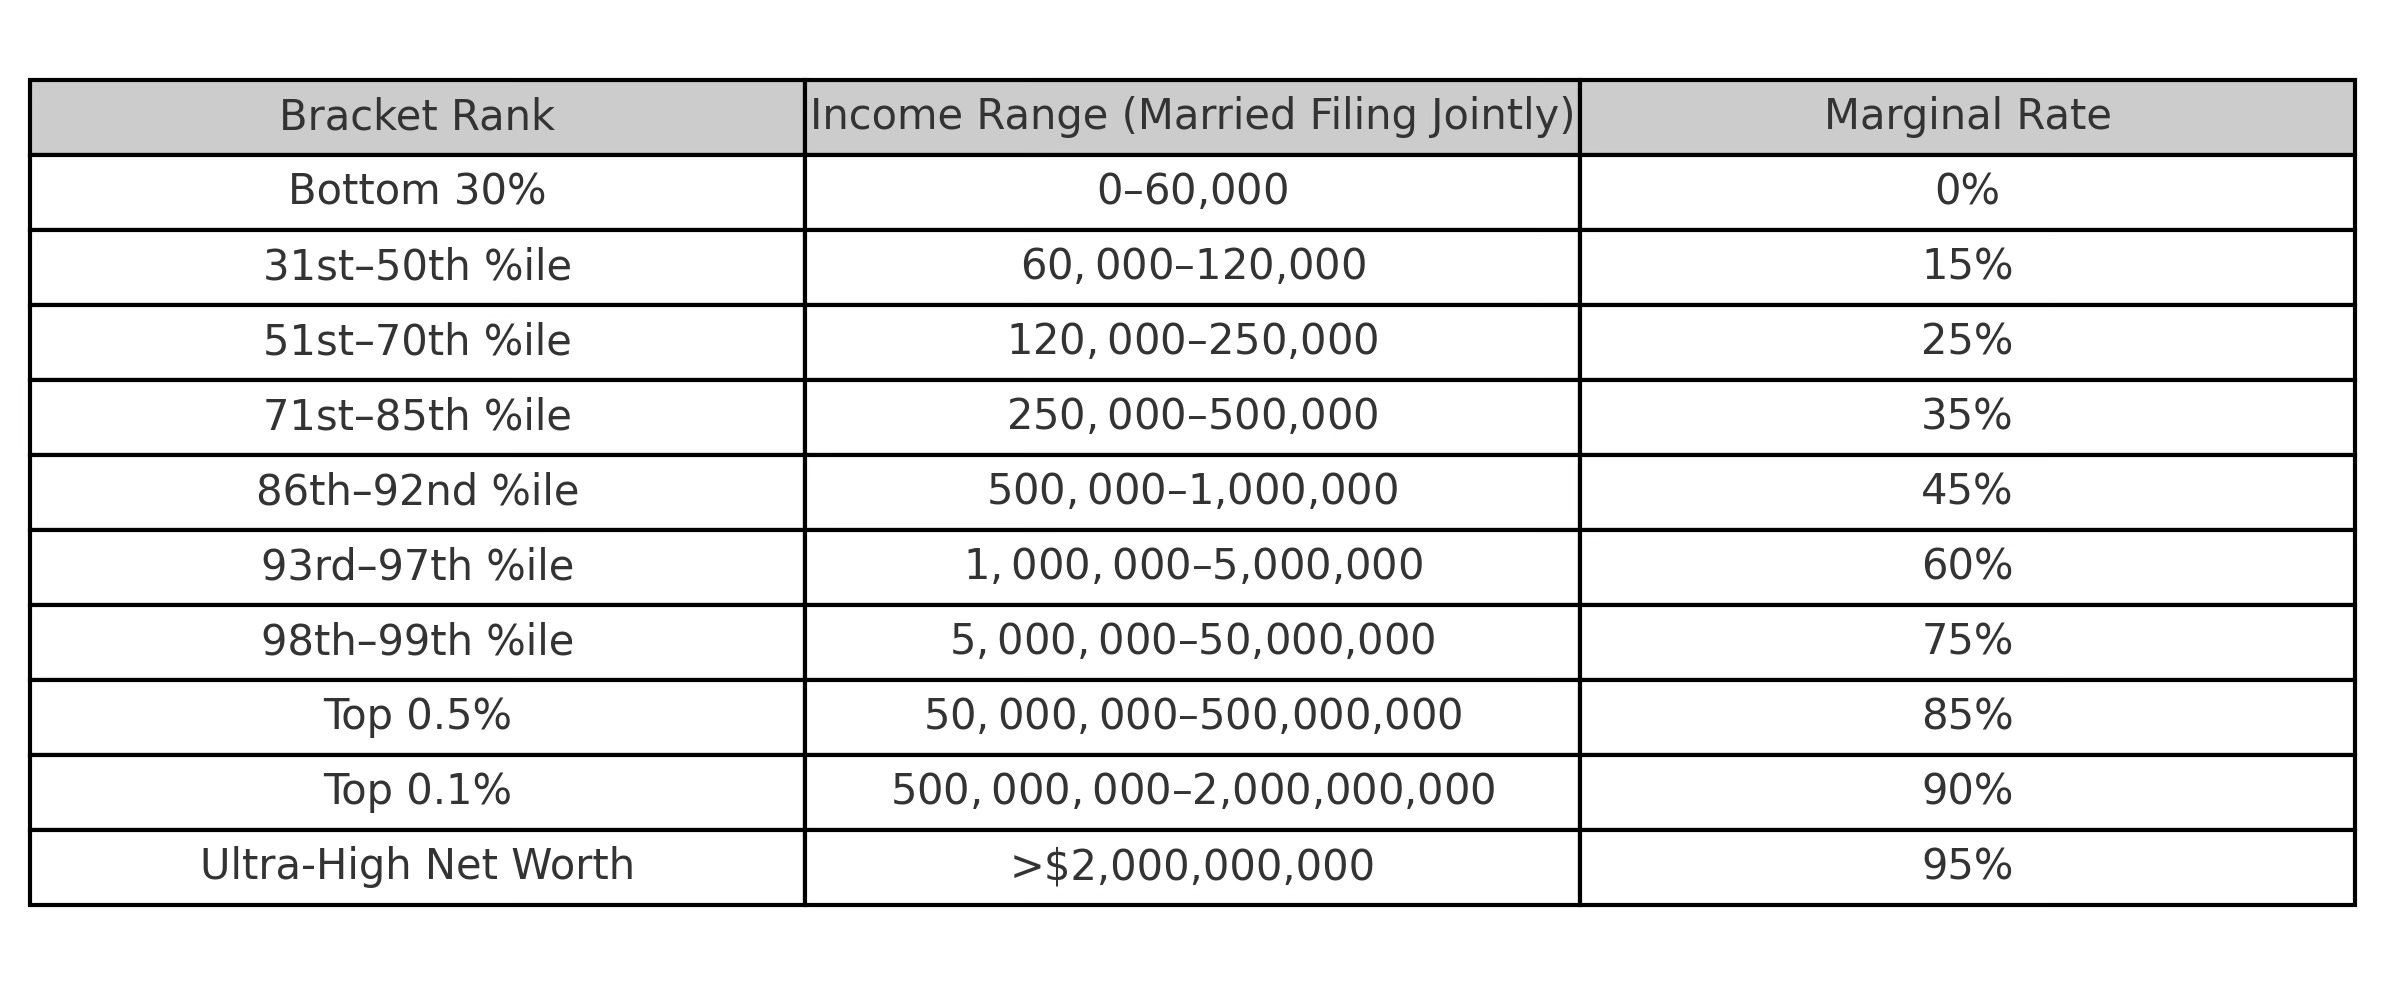
Goal: Significantly increase progressively, protecting bottom-half incomes while raising revenue from top earners.
Who does this impact and by how much:
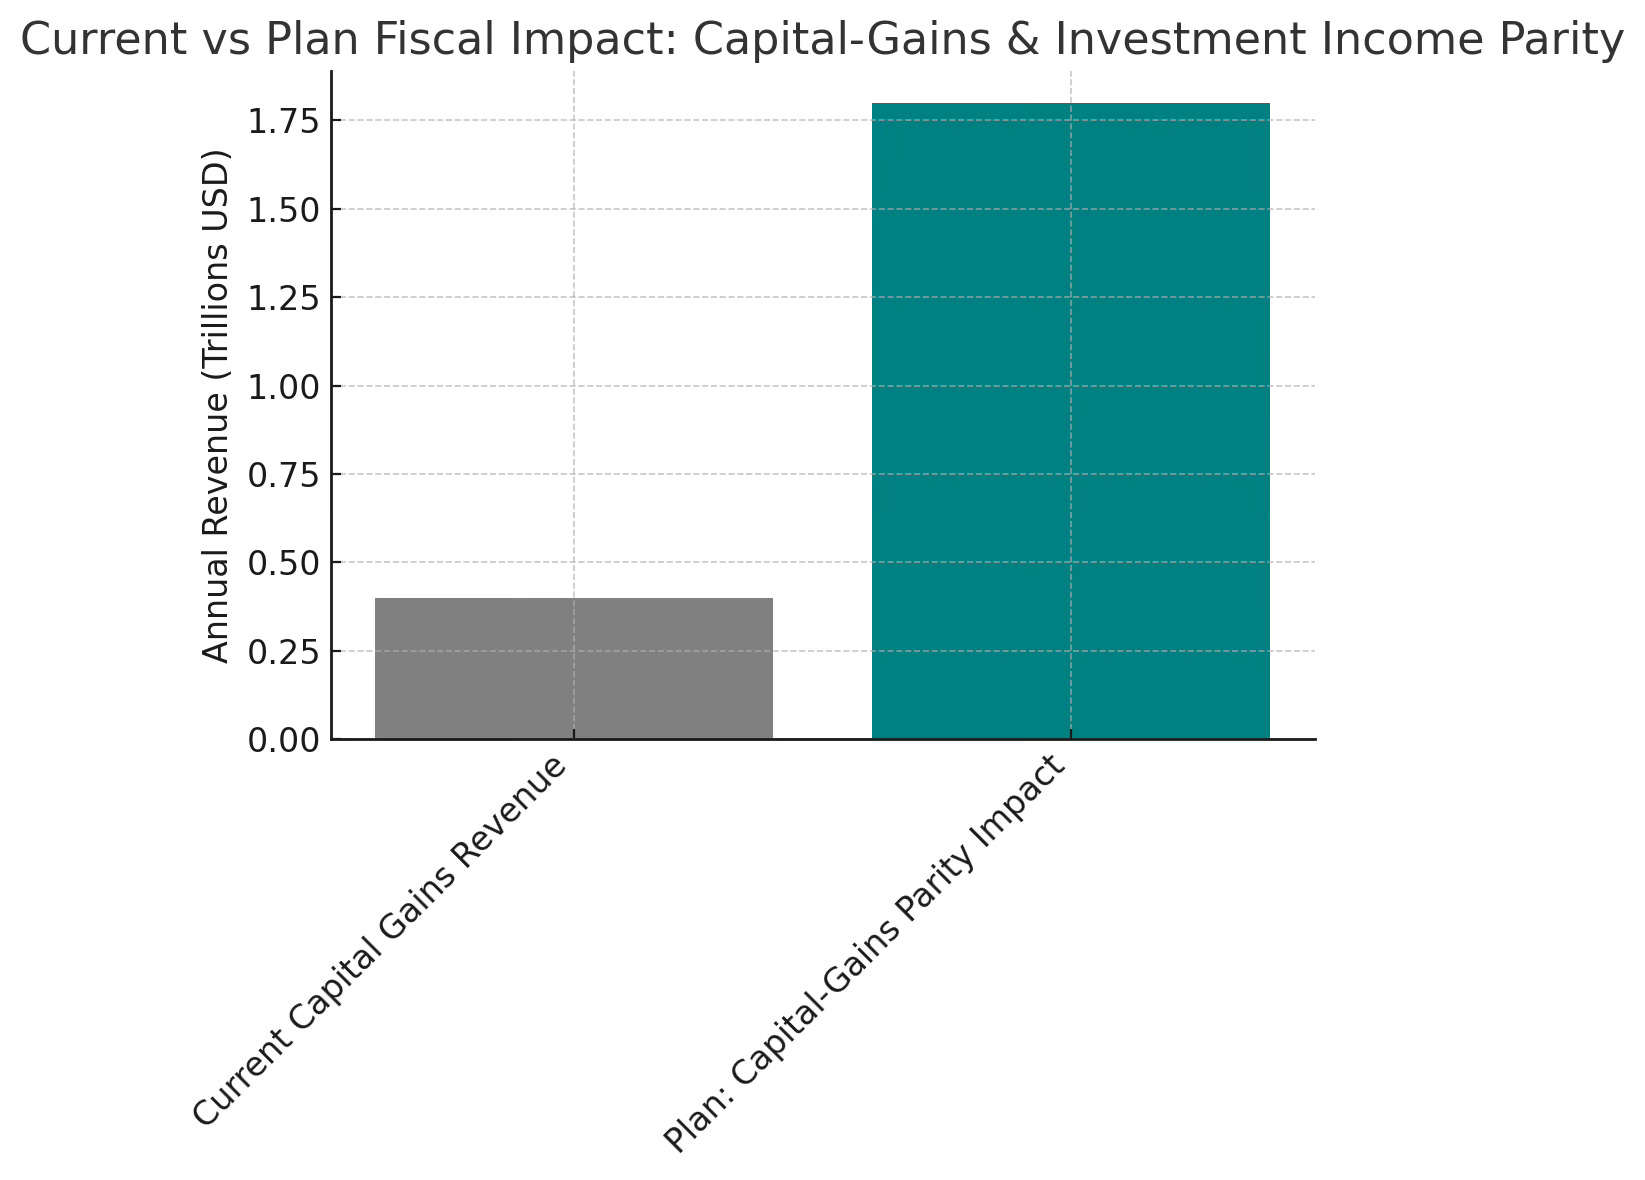
II. Capital-Gains & Investment Income Parity
Estimated Fiscal Impact: Generates an estimated ~$1.8 trillion per year from ending preferential rates, carried-interest parity, and abolishing basis step-up.
Ordinary-Income Treatment: All capital gains and dividends taxed at ordinary-income rates above $250k.
Carried-Interest: Treated as ordinary compensation.
Step-Up Basis Abolished: Heirs inherit original cost basis; gains realized at sale or via mark-to-market.
End 1031 Exchanges: Real-estate transfers recognized as taxable events.
Mark-to-Market Levy: 1% annual on unrealized gains for net worth > $50M.
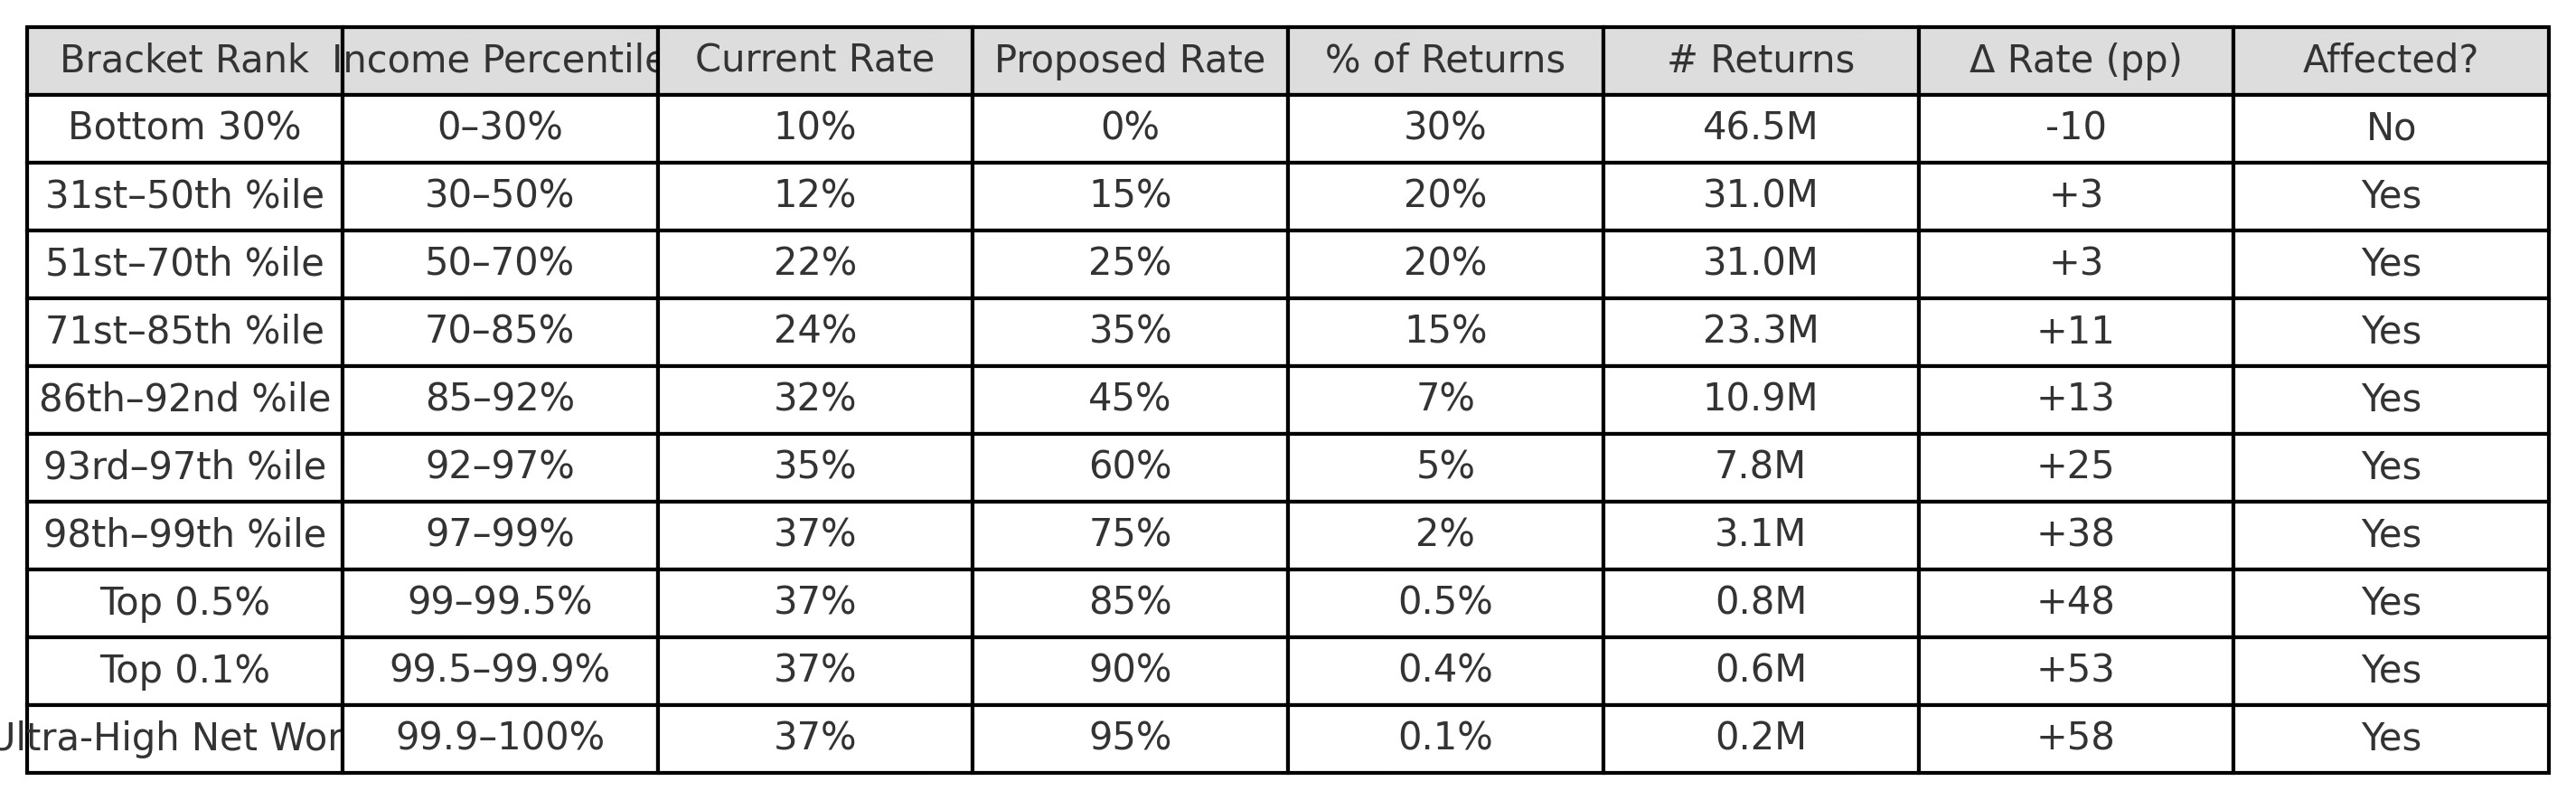
Who does this impact:
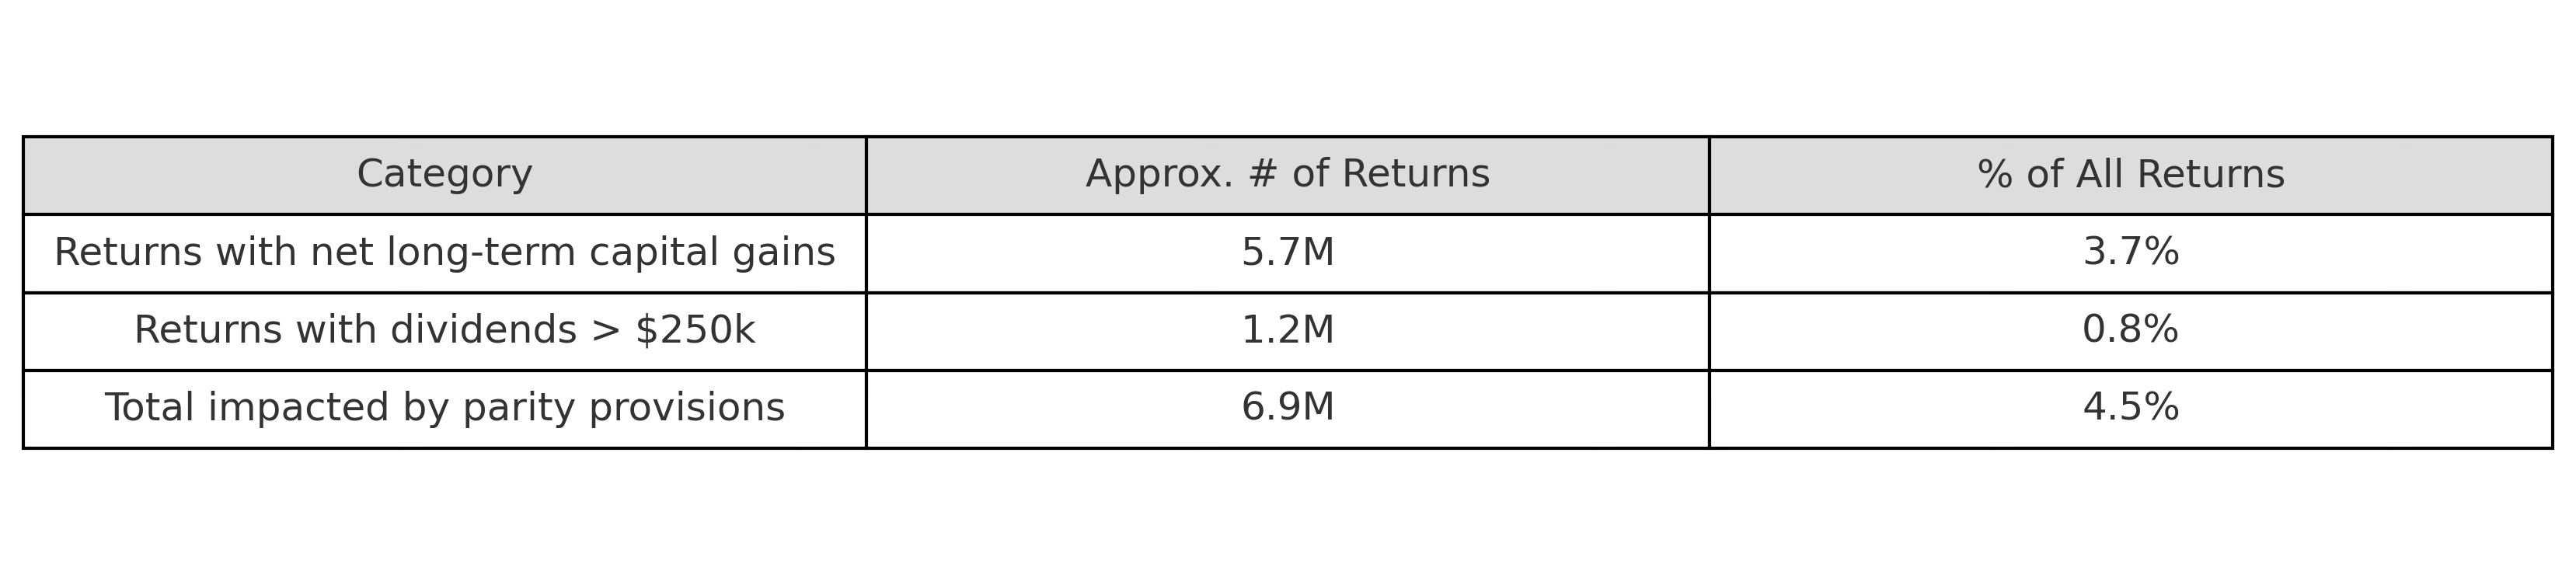
Roughly speaking, the Capital-Gains & Investment Income Parity rules (eliminating the preferential 15%/20% rates above $250 k, closing carried‐interest, ending step-up basis, etc.) would affect on the order of 6–8 million individual income tax returns each year. Here’s a rough breakdown:
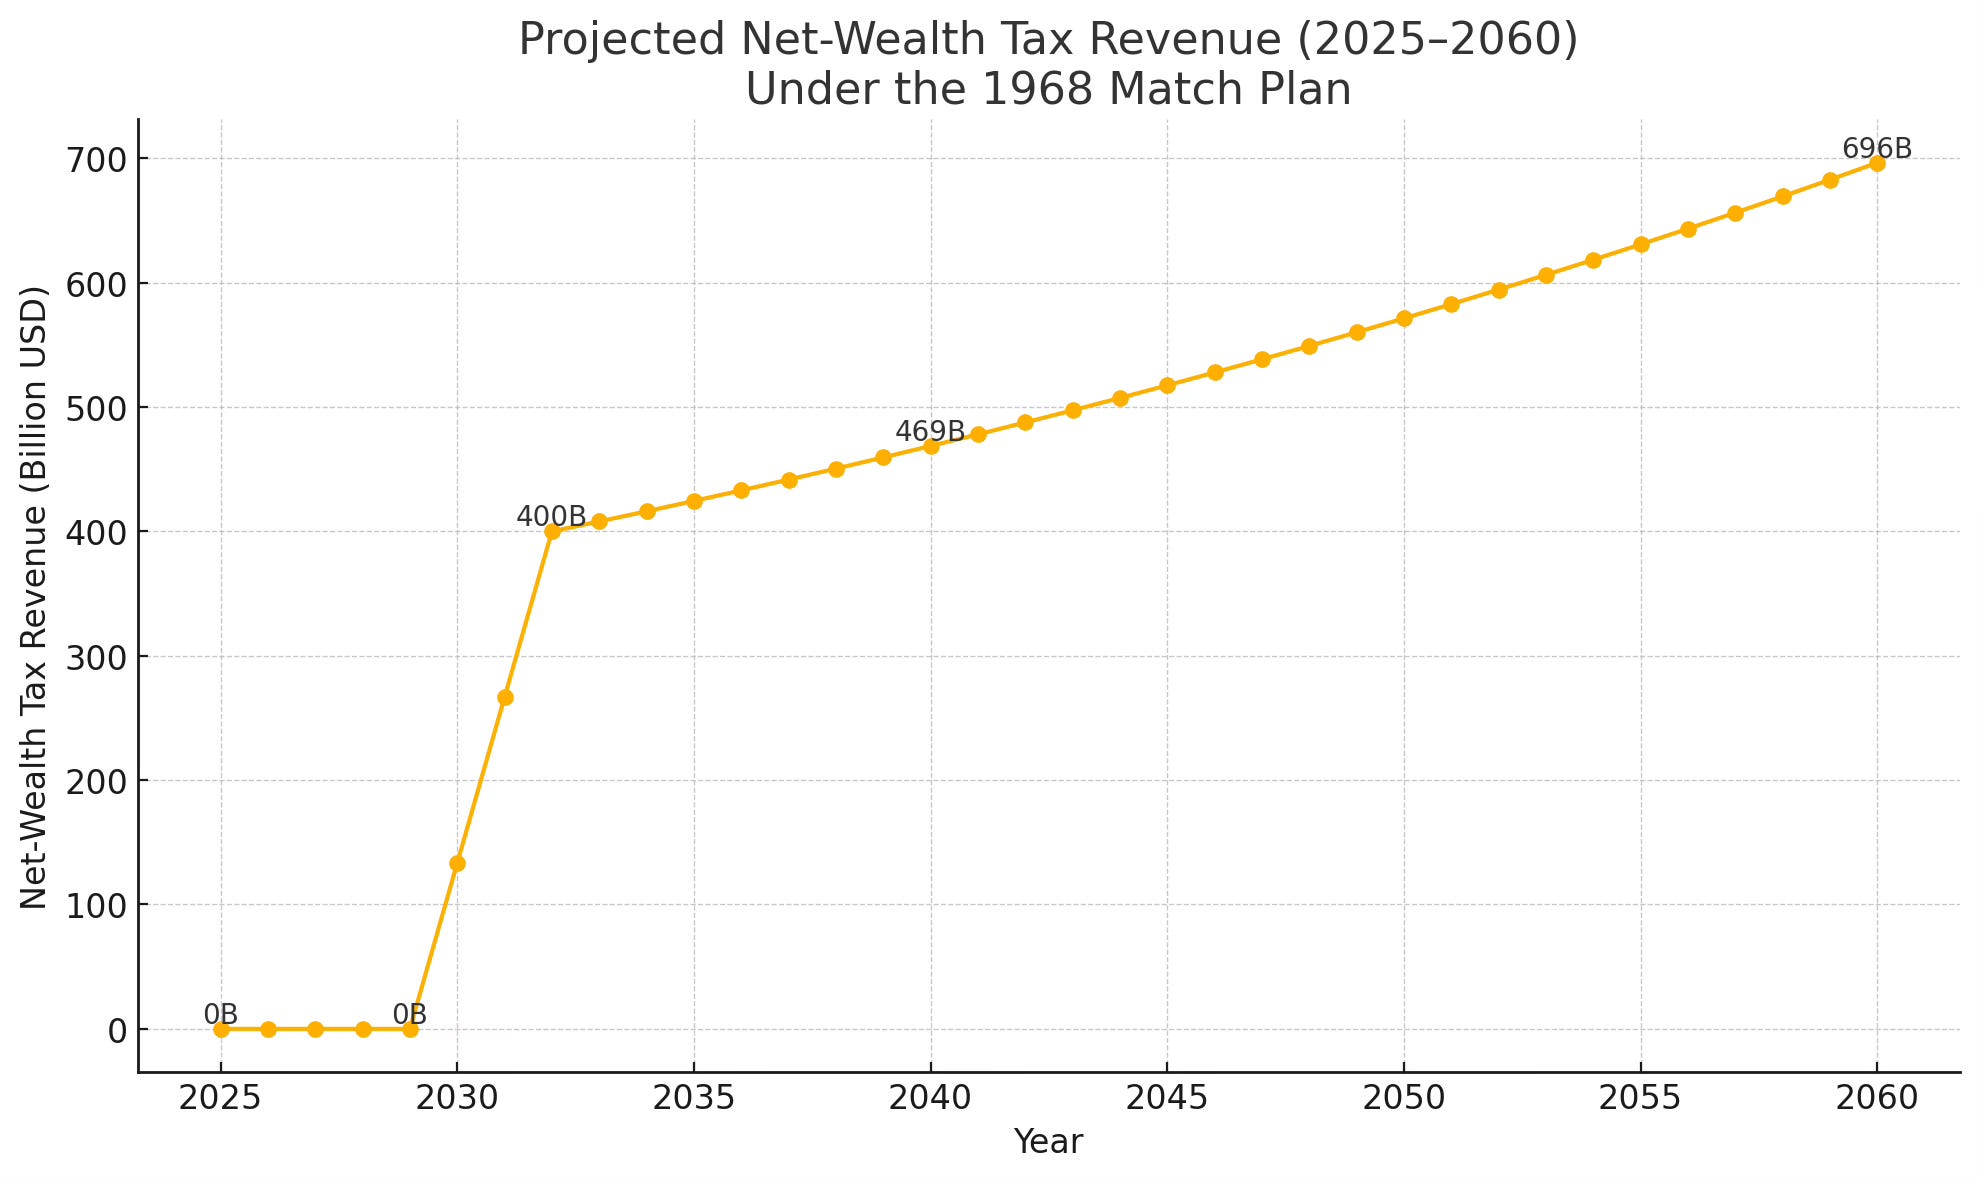
III. Net-Wealth Tax
Estimated Fiscal Impact: Yields approximately $400 billion annually, scalable with the escalator trigger.
2% annual tax on net worth > $50M
3% annual on net worth > $500M
Escalator Trigger: If Top 1% share > 17% (five-year rolling average), rates rise +0.5pp.
2% annual tax on net worth > $50M
3% annual on net worth > $500M
Escalator Trigger: If Top 1% share > 17% (five-year rolling average), rates rise +0.5pp.
Who does this impact:

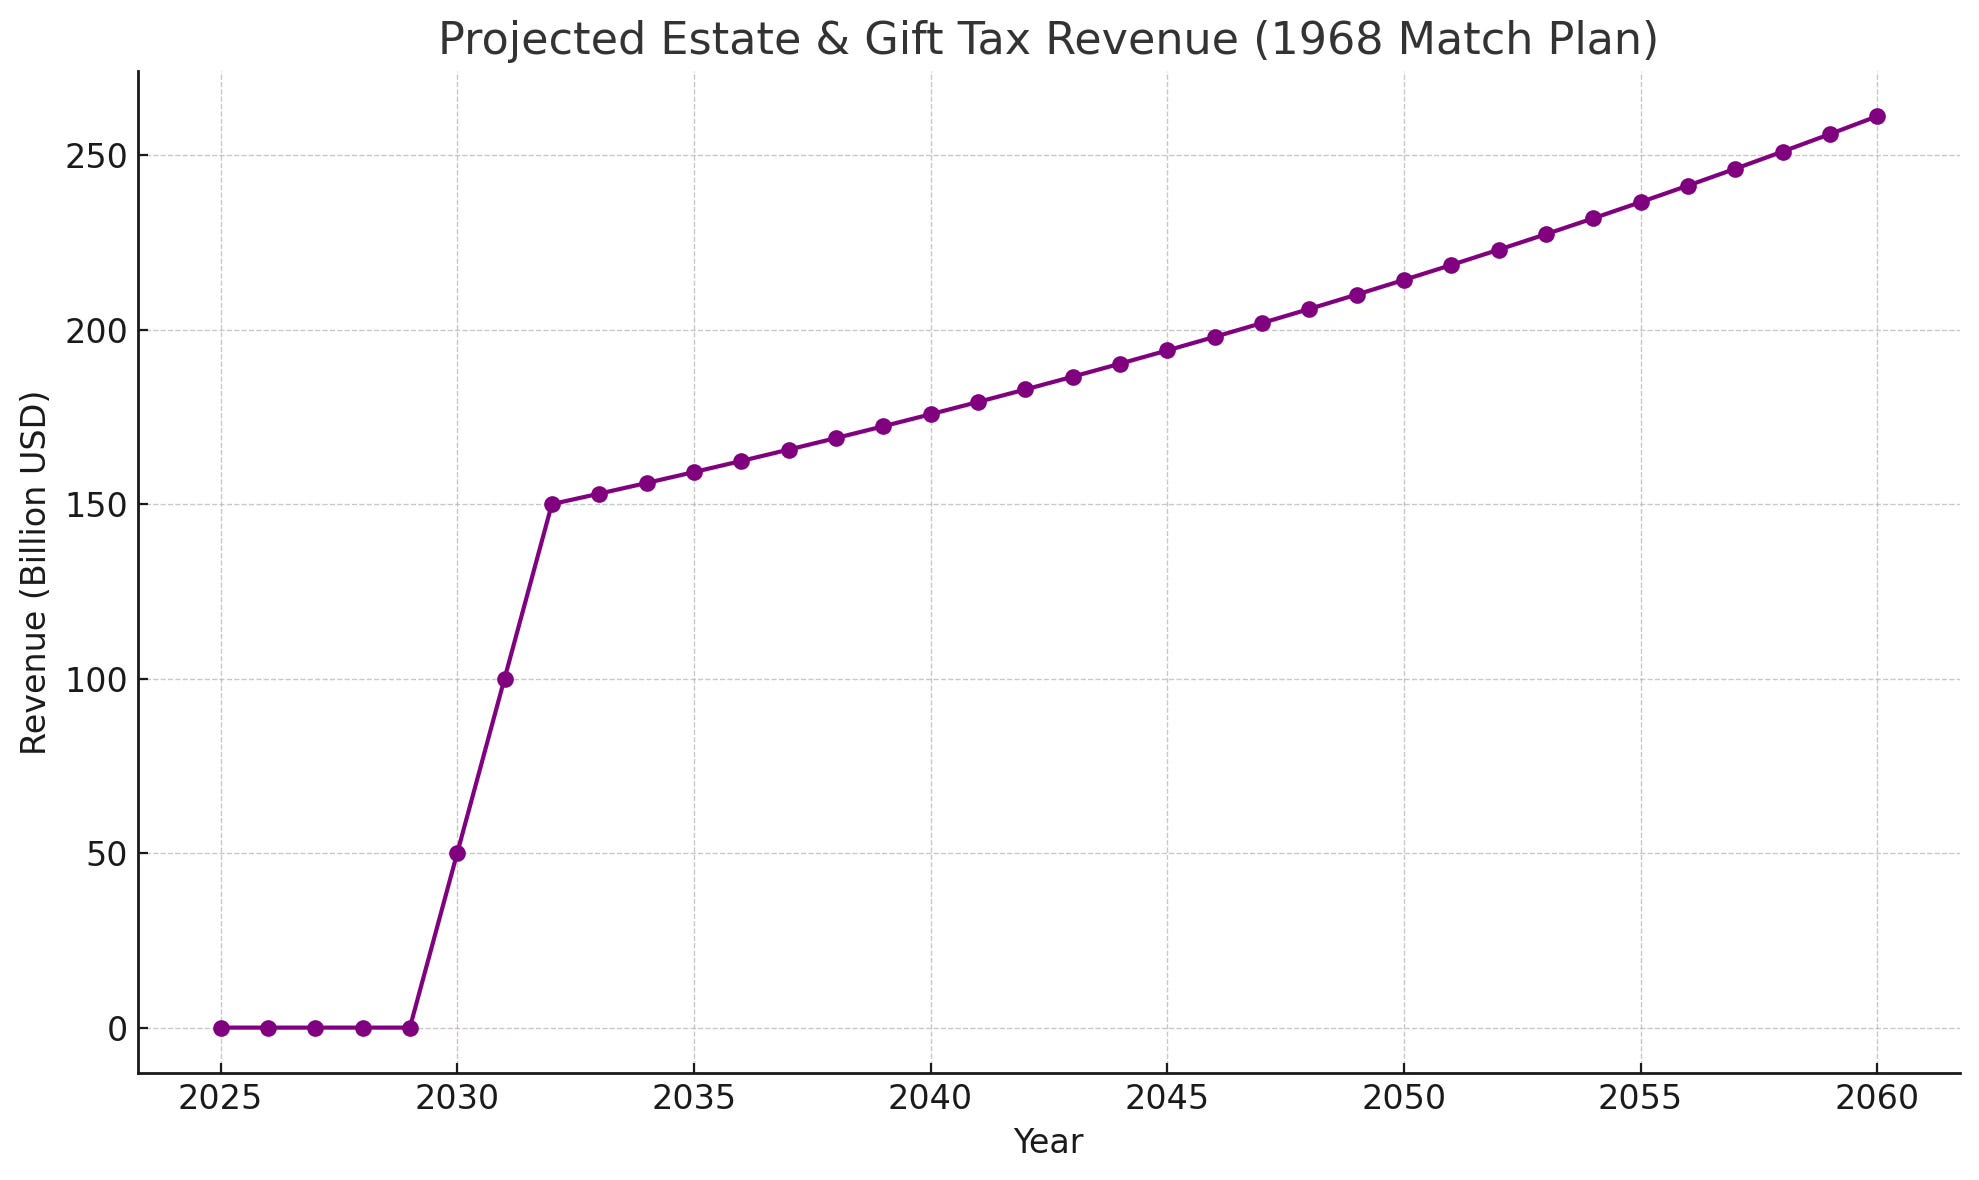
IV. Estate & Gift Tax Reform
Estimated Fiscal Impact: Expected to collect ~$150 billion per year in additional revenue once fully implemented.
Lifetime exemption lowered to $5M per individual.
Progressive brackets:
$5–$20M → 40%
$20–$100M → 55%
$100M → 70%.
Objective: Prevent dynastic wealth locks, recycle fortunes into the broader economy.
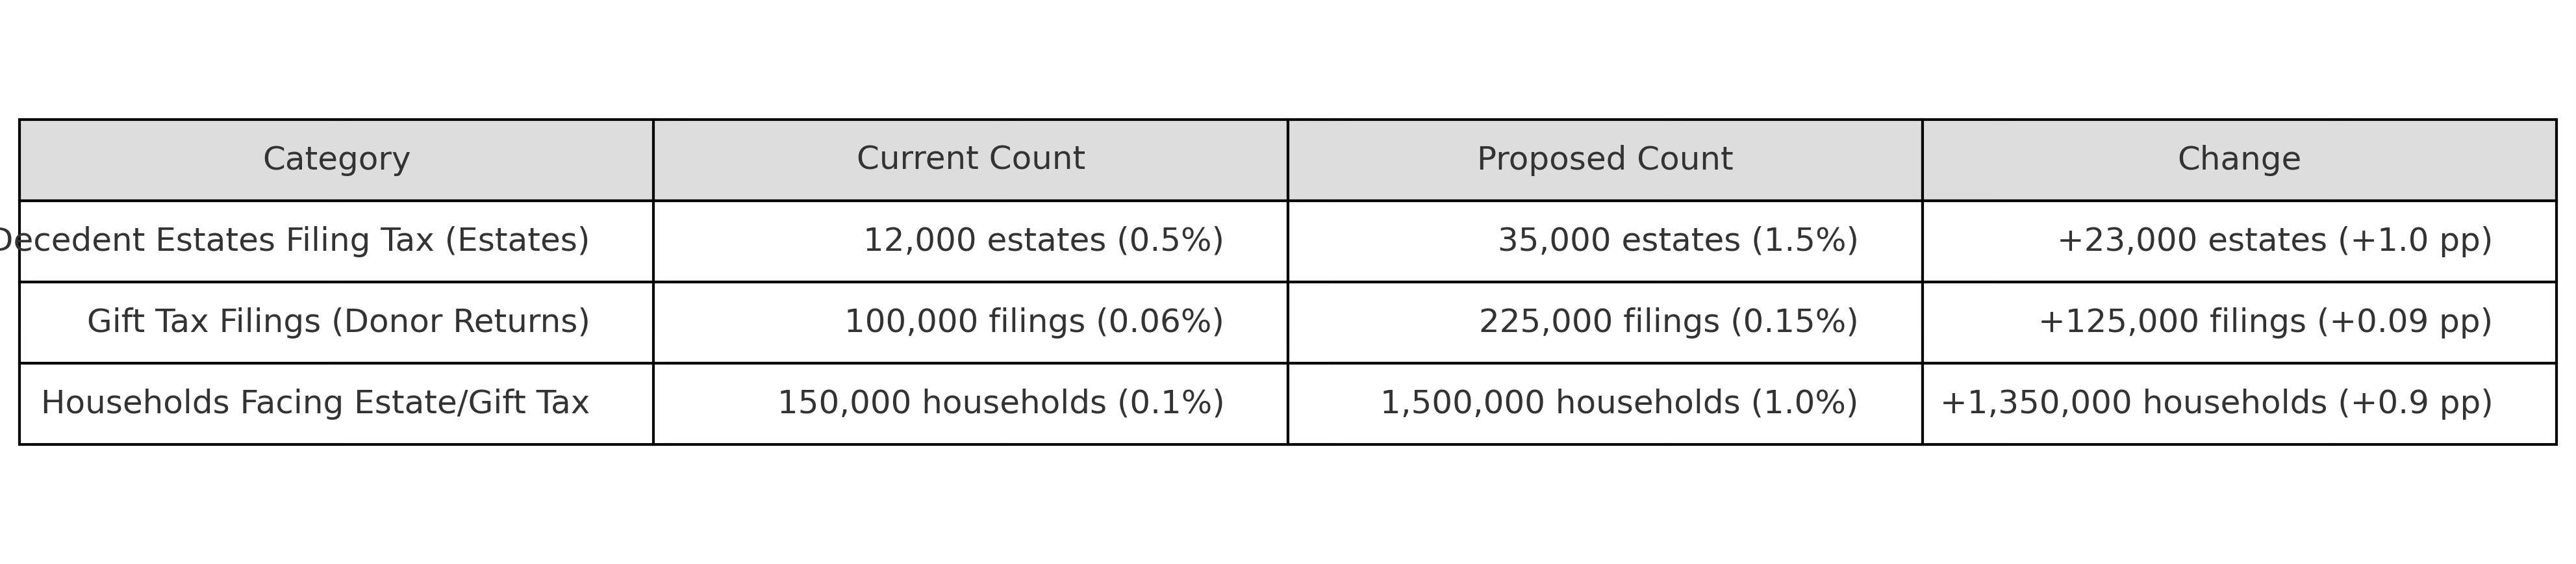
Who’s impacted:
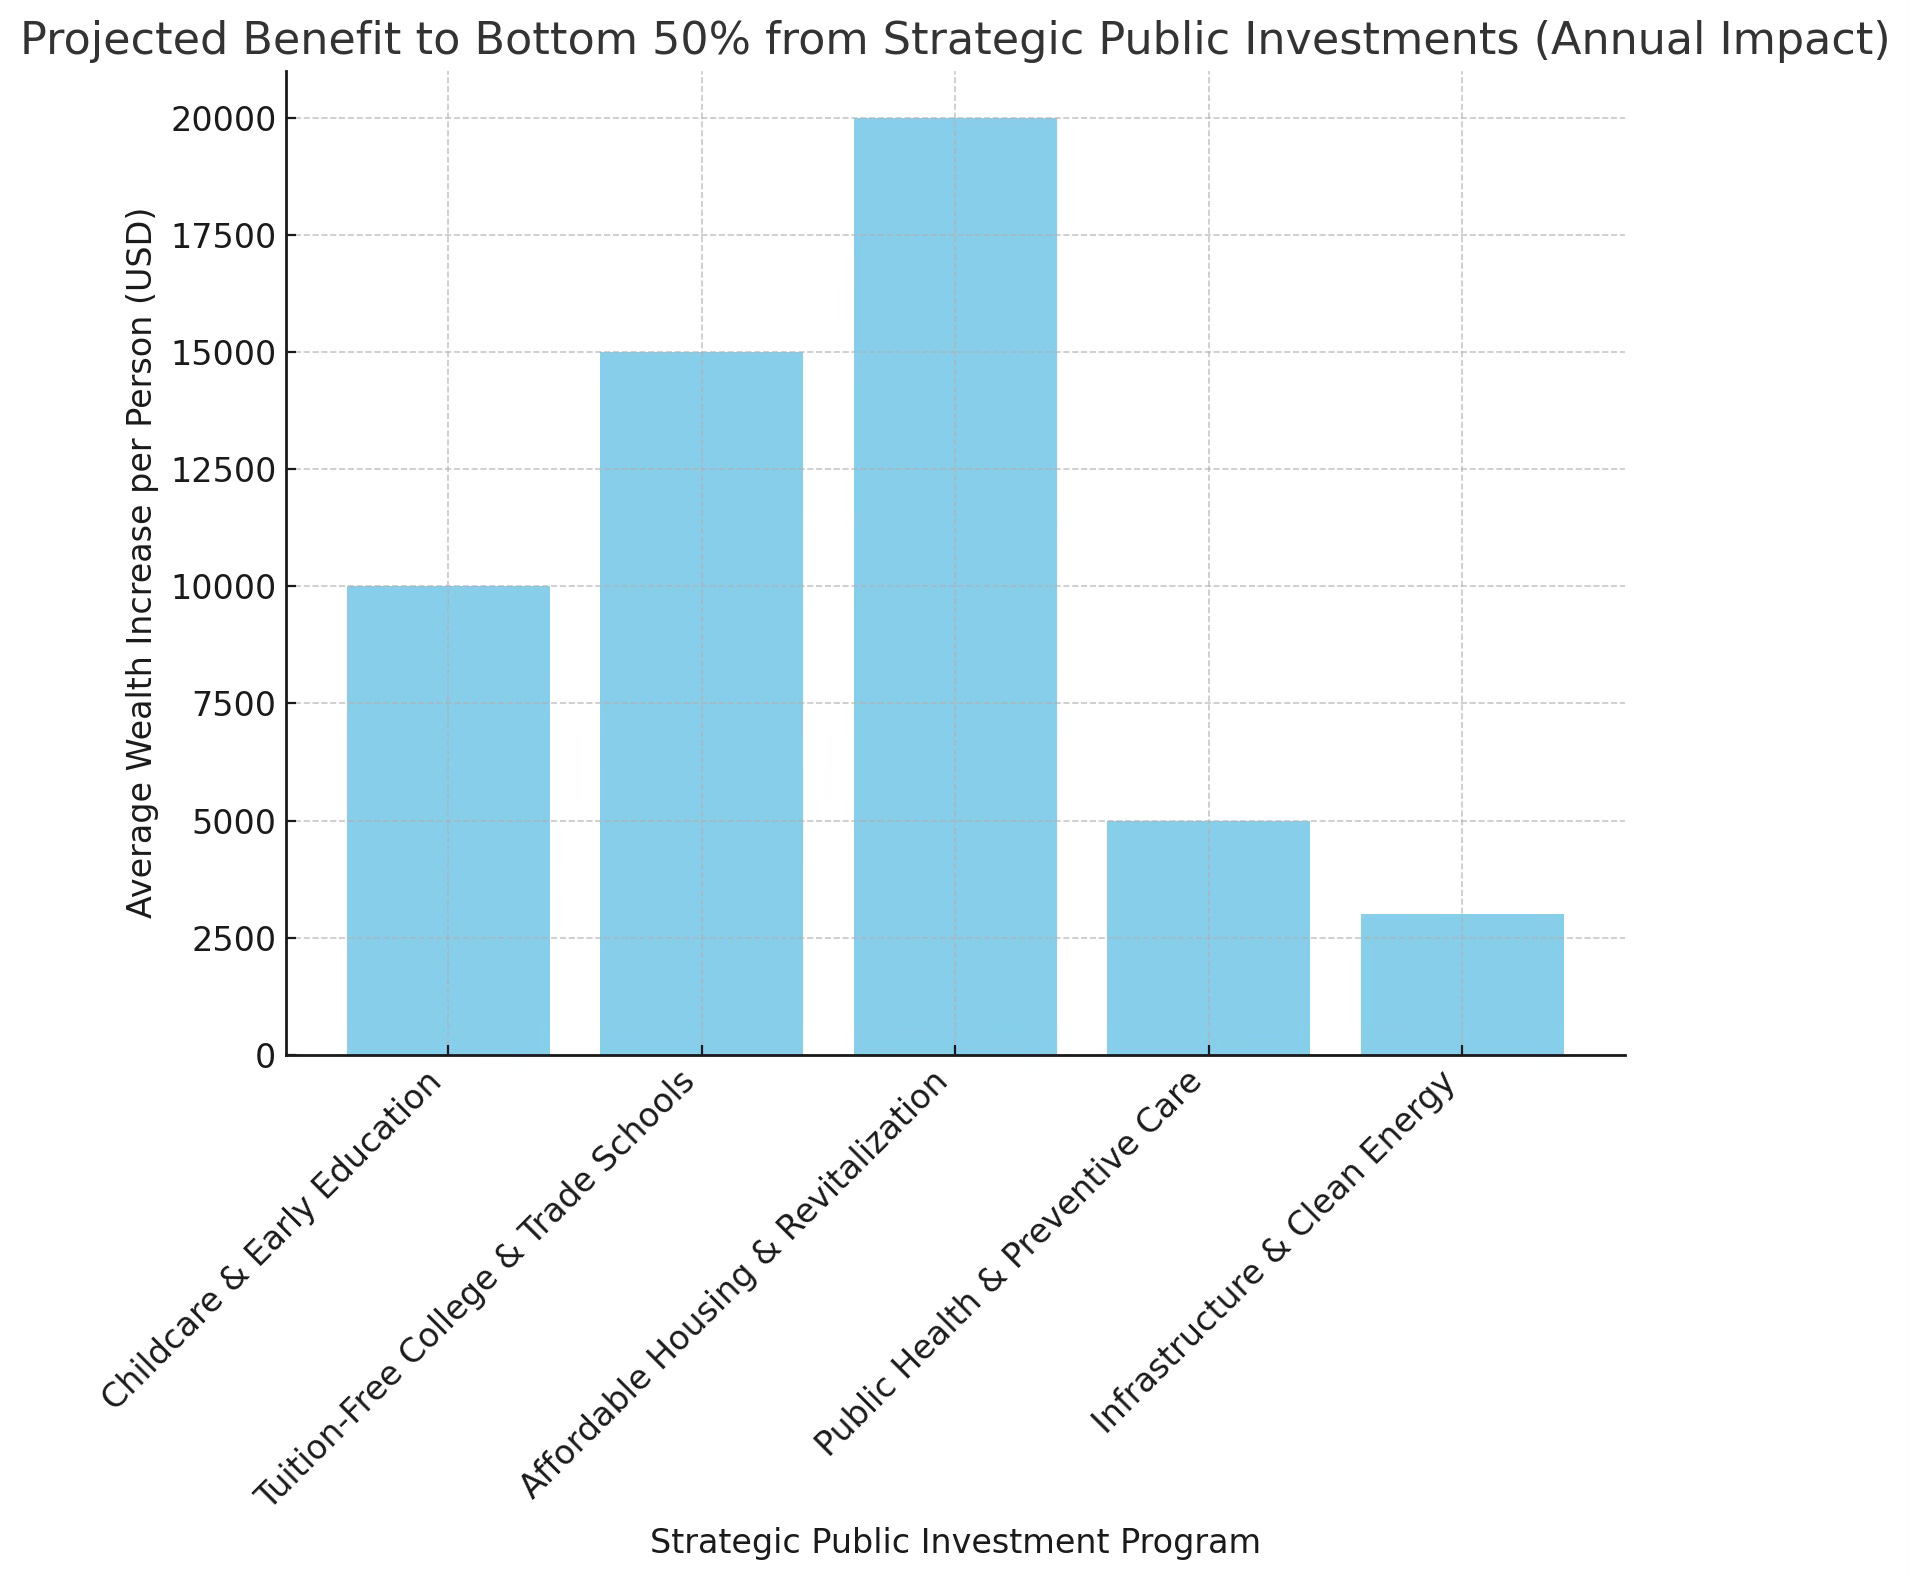
V. Strategic Public Investments
Estimated Fiscal Impact: Deploys ~$800 billion annually toward wealth-building programs for the bottom 50% (fully ring-fenced from new revenues).
Revenue directed to:
Universal Childcare & Early Education
Tuition-Free College & Trade Schools
Affordable Housing & Community Revitalization
Public Health & Preventive Care
**Infrastructure & Clean Energy
Impact: Directly builds balance sheets of bottom 50%, lowers barriers to asset accumulation.
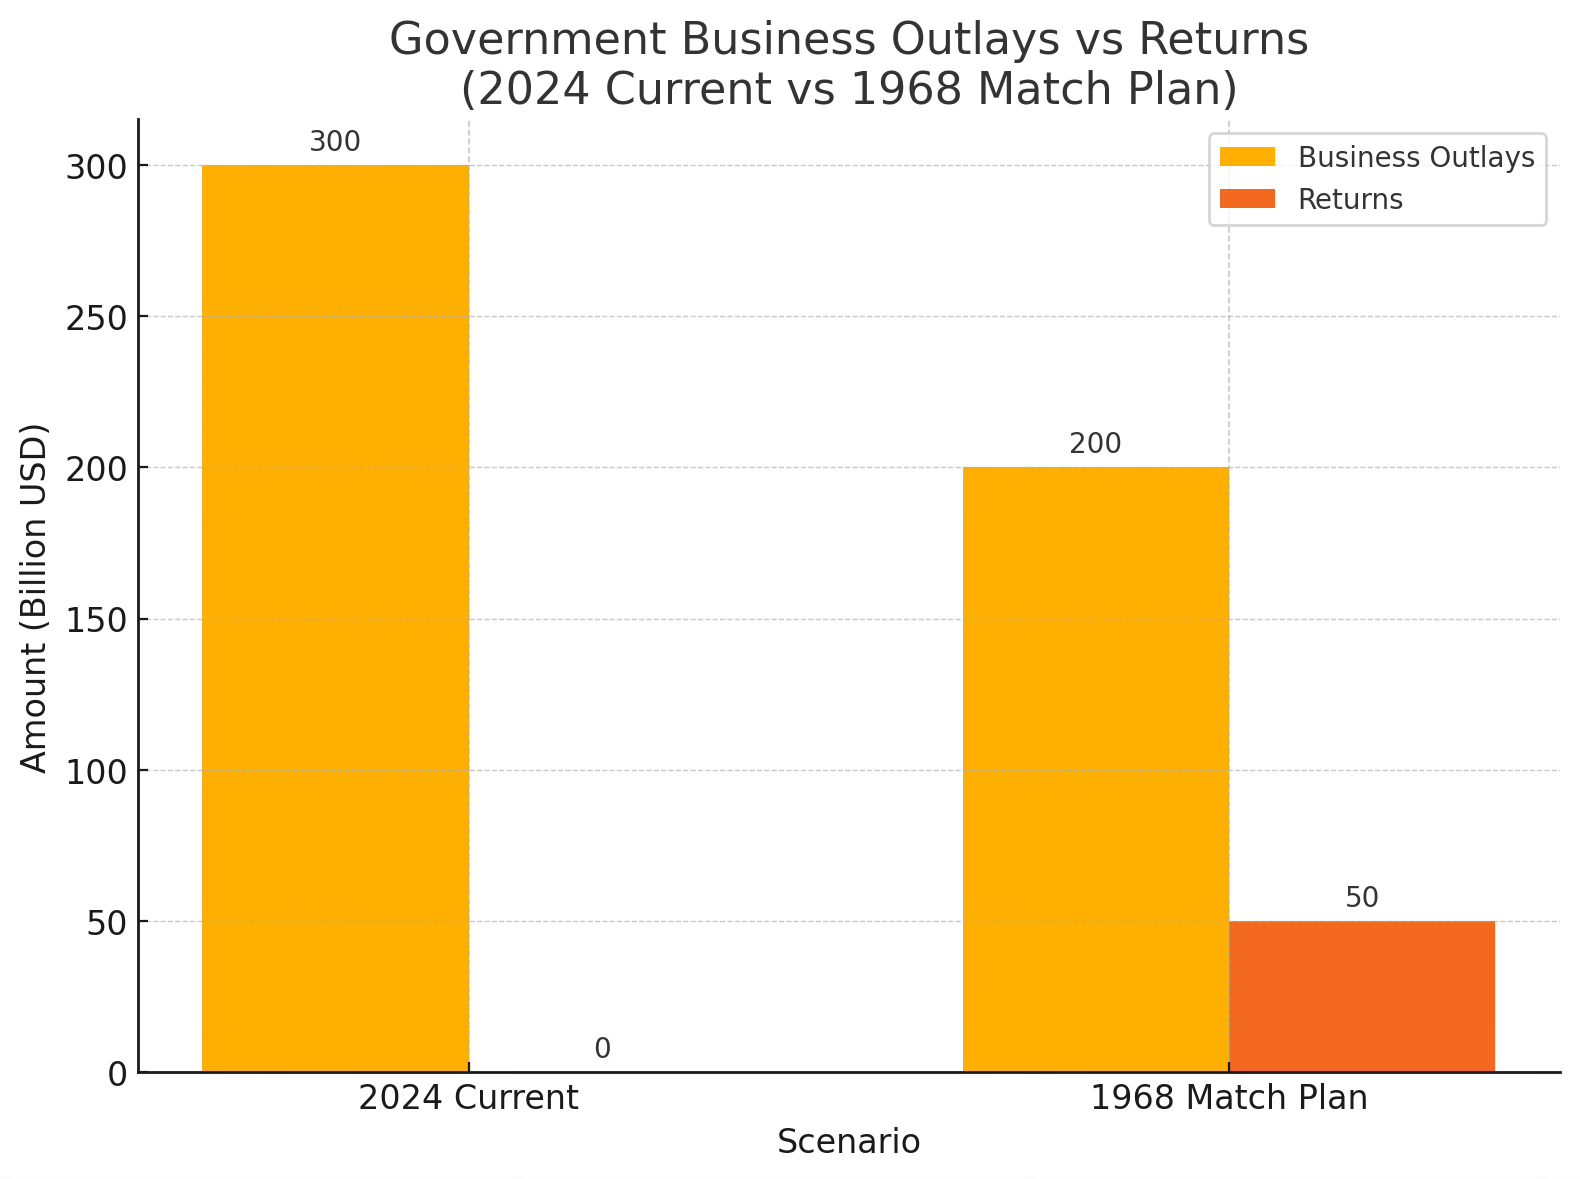
VI. Co‑Investment & Return Mechanisms
Estimated Fiscal Impact: Leverages an additional ~$200 billion in private capital matched by ~$200 billion public funds annually, unlocking ~$400 billion in new project investment and generating ~$50 billion of net public returns per year.
Public‑Private Matching Funds: Govt matches up to 50% of private capital in approved community/green projects.
Shared-Risk SPVs: Profit split with minimum 30% public share.
Innovation Bonds: Tax‑favored bonds with ROI-linked coupons and principal guarantee.
Benefit: Leverages private capital, gives taxpayers a direct stake in returns.
VII. ROI‑Driven Outlays & Portfolio Management
Estimated Fiscal Impact: Improves annual program efficiency by ~15%, reallocating ~$120 billion from underperforming to high-impact initiatives, yielding an estimated additional ~$80 billion in bottom-half net-worth gains each year.
Central Fiscal Performance Office (CFPO): Independent agency allocates new funds based on projected ROI, social impact, and wealth-gap reduction metrics.
Annual Scorecards: Evaluate programs; top quartile receive ≥60% of new outlays.
Quarterly Rebalancing: Shift resources to highest‑impact initiatives.
Result: Dynamic optimization of public spending for maximum bottom-half wealth gain.
Example Impact using 2024:
VIII. Automatic Adjustment Mechanism
Estimated Fiscal Impact: Ensures timely policy calibration, potentially increasing top‑bracket and wealth-tax revenues by ~$50 billion every adjustment cycle when targets lag.
Five-Year Reviews: Based on Federal Reserve SCF data.
If Bottom 50% share <12%, trigger +5pp on top-bracket or wealth tax rates until convergence path corrected.
Effect: Keeps policy reactive, data‑driven, and on target for 2060.
IX. Implementation Roadmap
Estimated Fiscal Impact: Front-loading reforms (2026–2032) yields ~$1.2 trillion in cumulative additional revenue by 2032; scaling investments (2033–2040) deploys ~$4 trillion in program outlays; fine-tuning (2041–2060) maintains trajectory with ~$2.5 trillion in iterative adjustments.
2026–2028: Enact income and capital-gains reforms.
2029–2032: Launch net-wealth and estate reforms; stand up CFPO.
2033–2040: Scale investments; refine adjustments.
2041–2060: Calibration and convergence monitoring.
1968 Match Plan Impact
Achieving a more equitable wealth distribution by 2060 demands bold, automated, and transparent policies: steeply progressive taxes; closed loopholes; targeted co‑investment; ROI‑centric spending; and hardwired feedback loops. No lip‑service, only measurable, enforceable steps to restore shared prosperity.
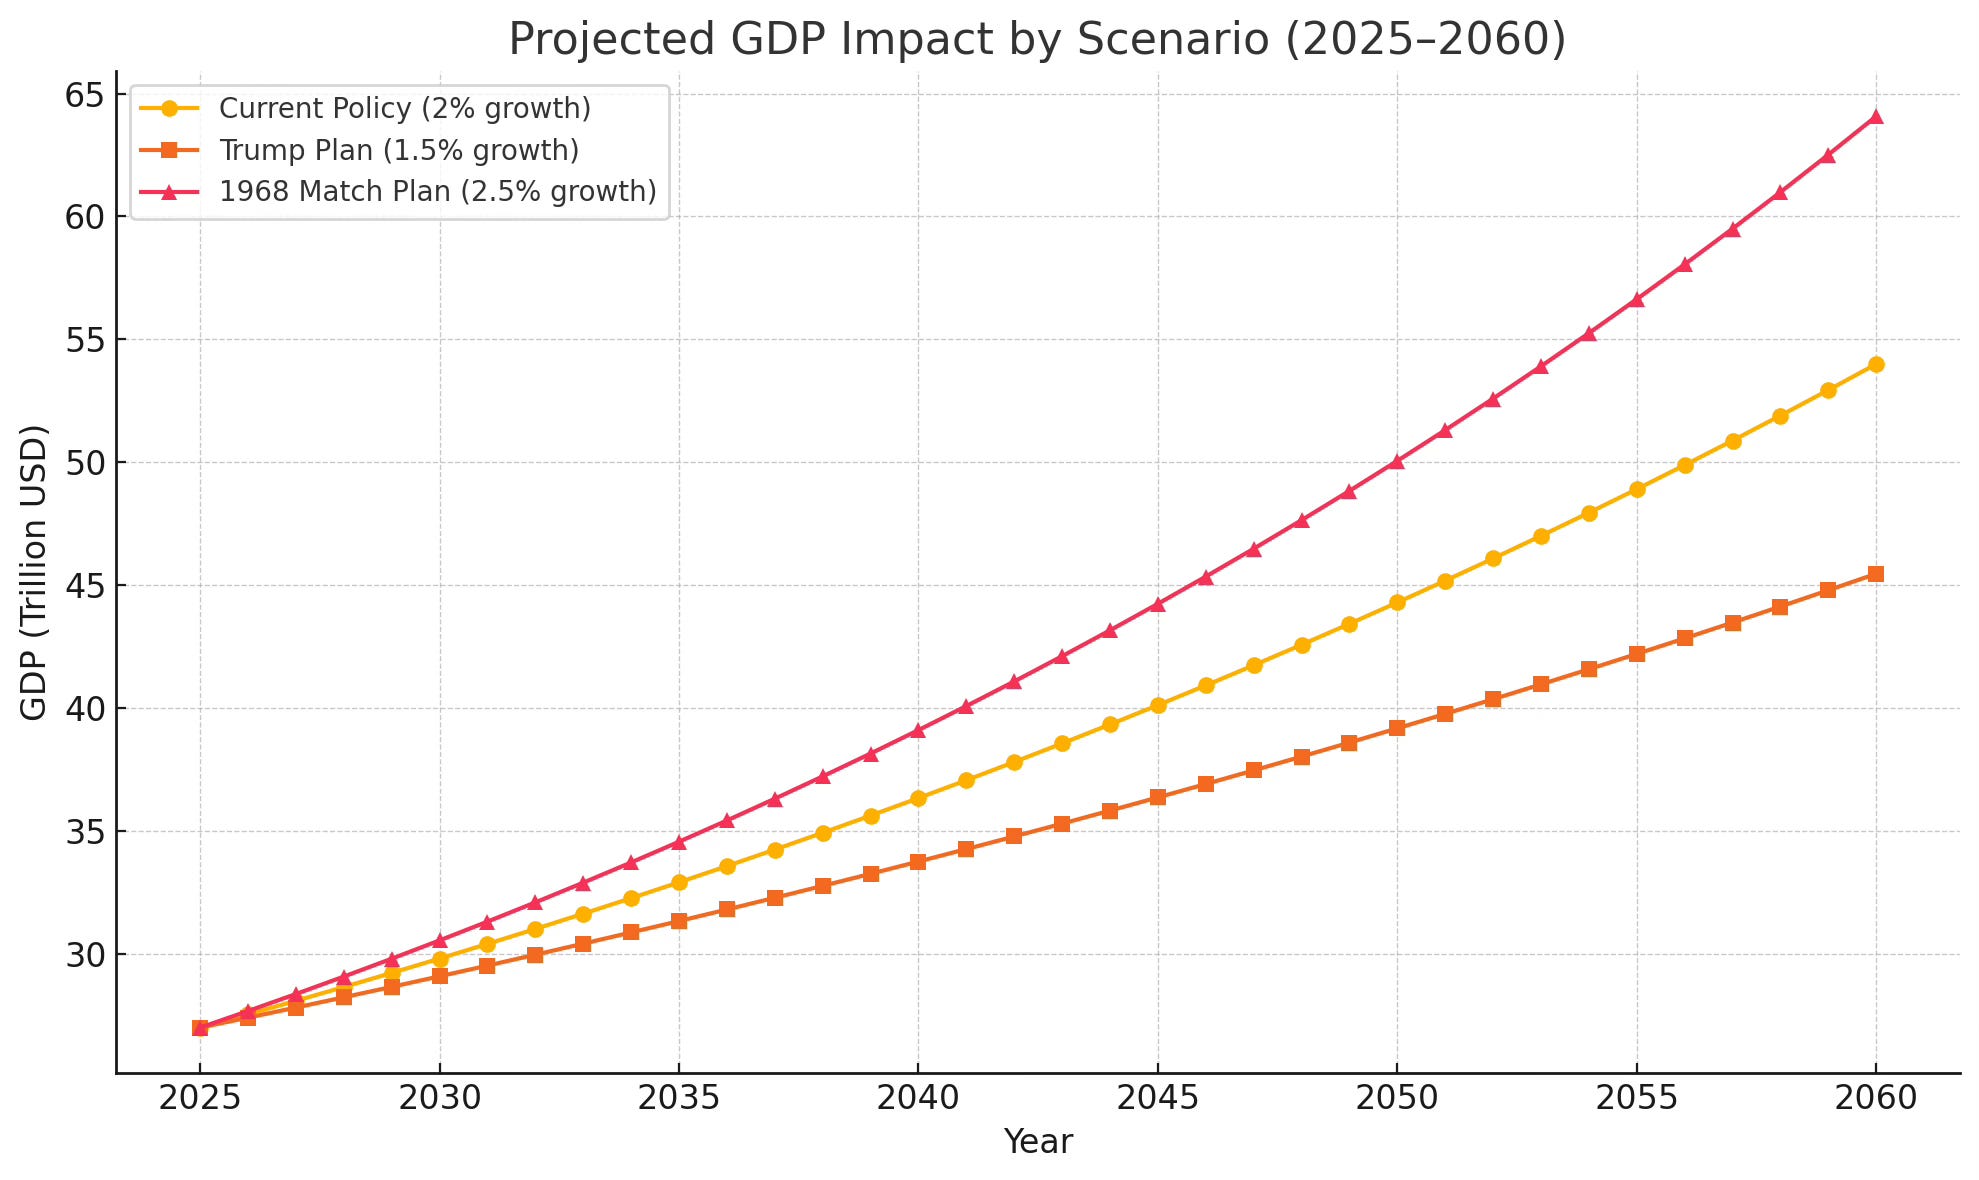
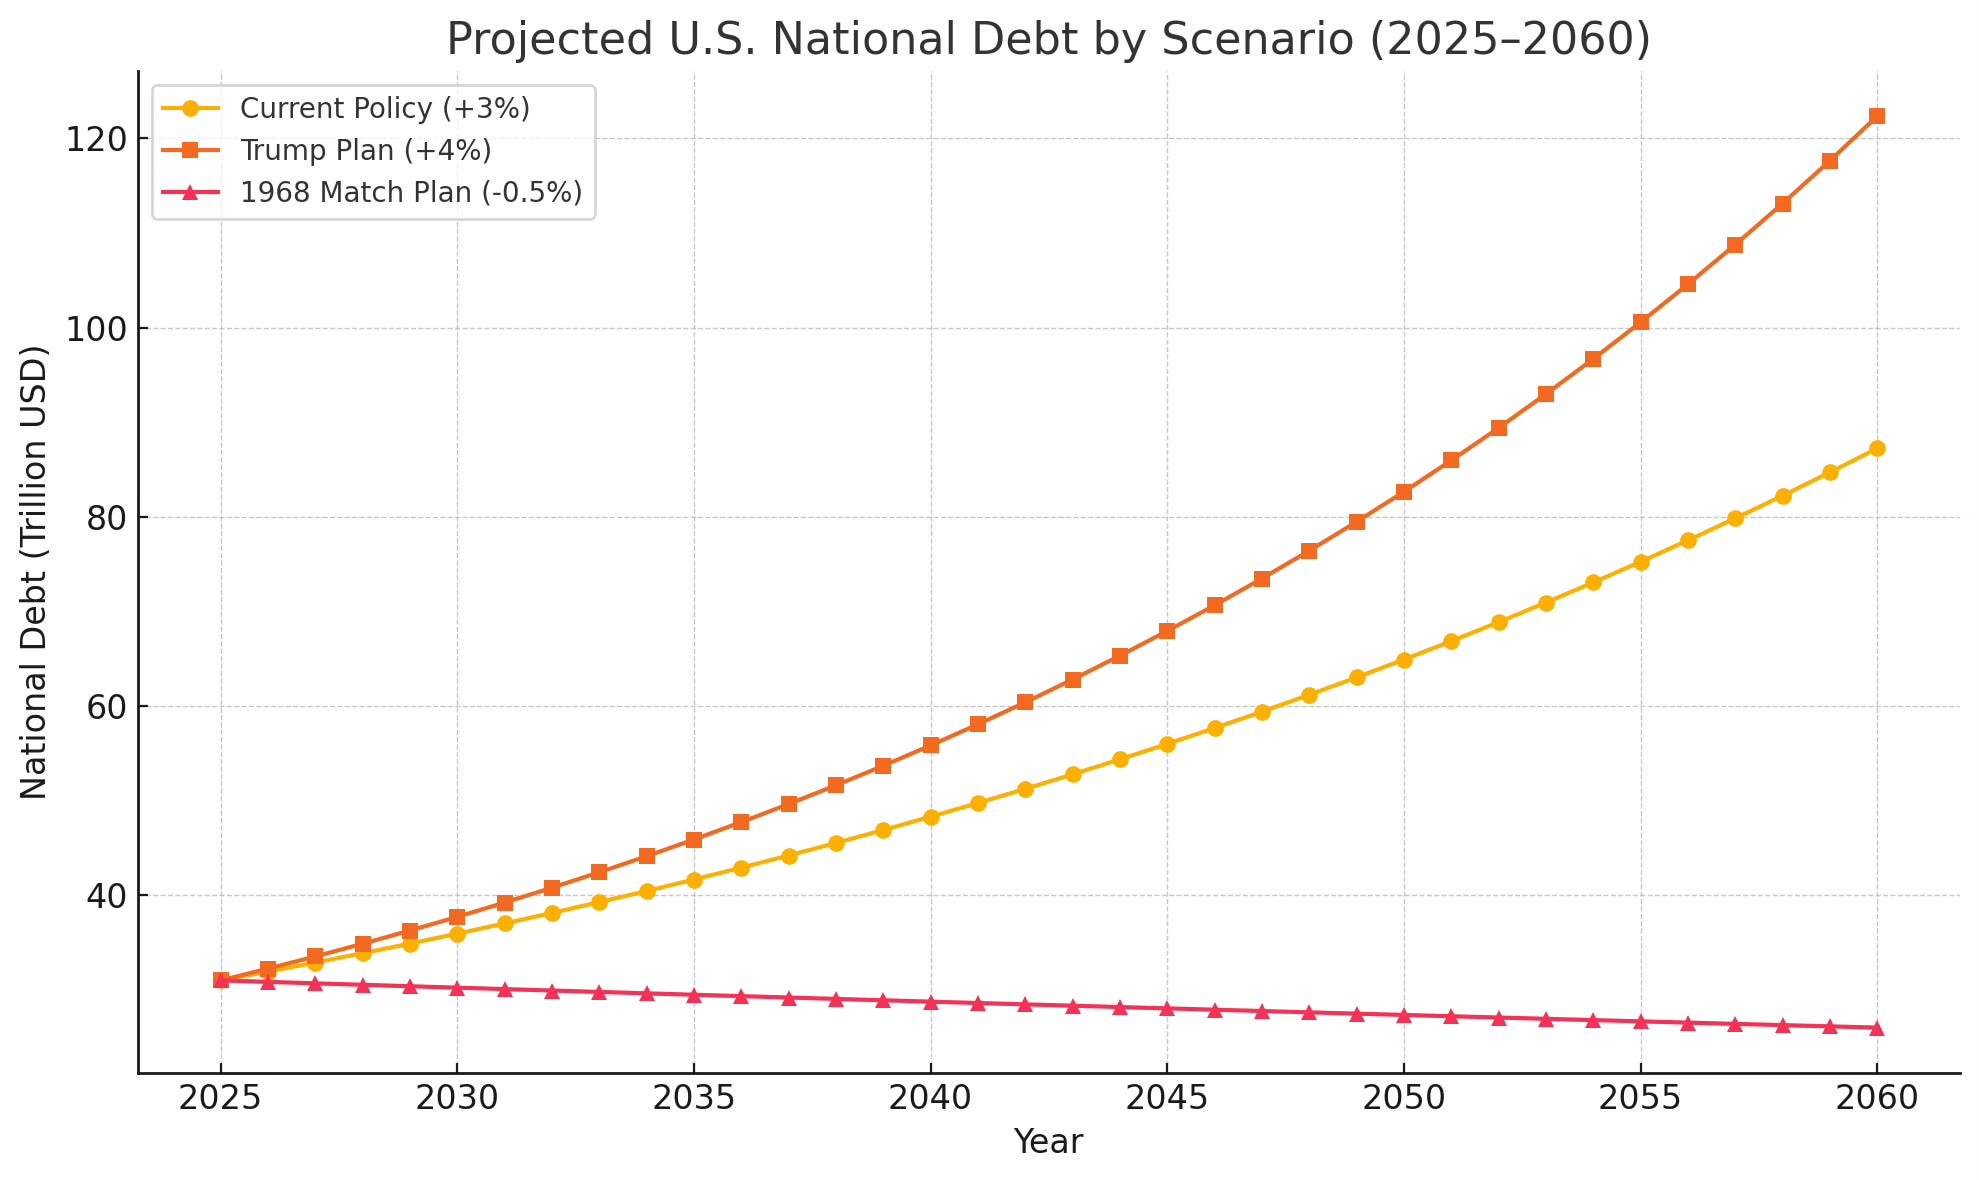
In the end, the projections using this plan show the US to be in a much better position.
Debit reduction:
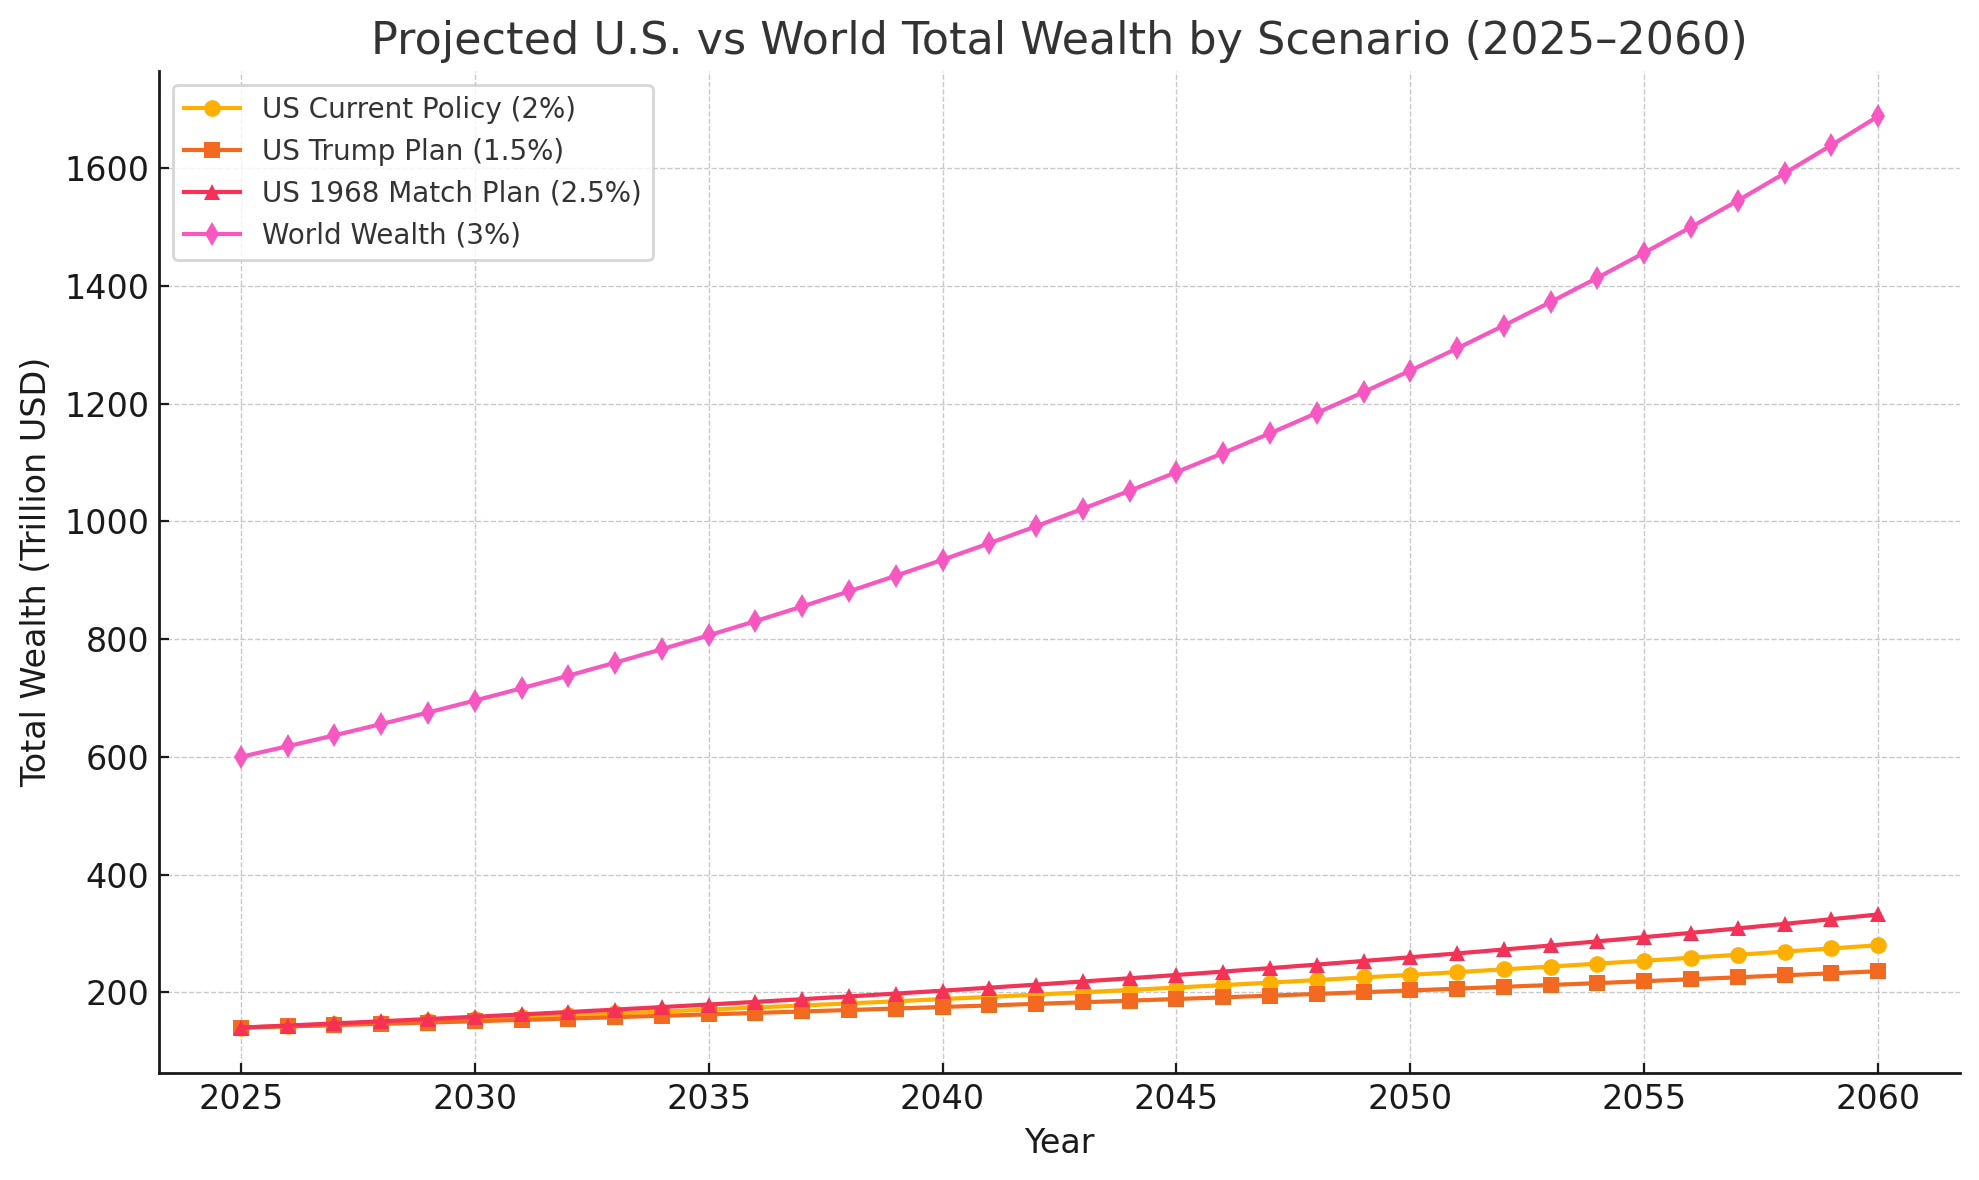
Our growth in the world comparison:
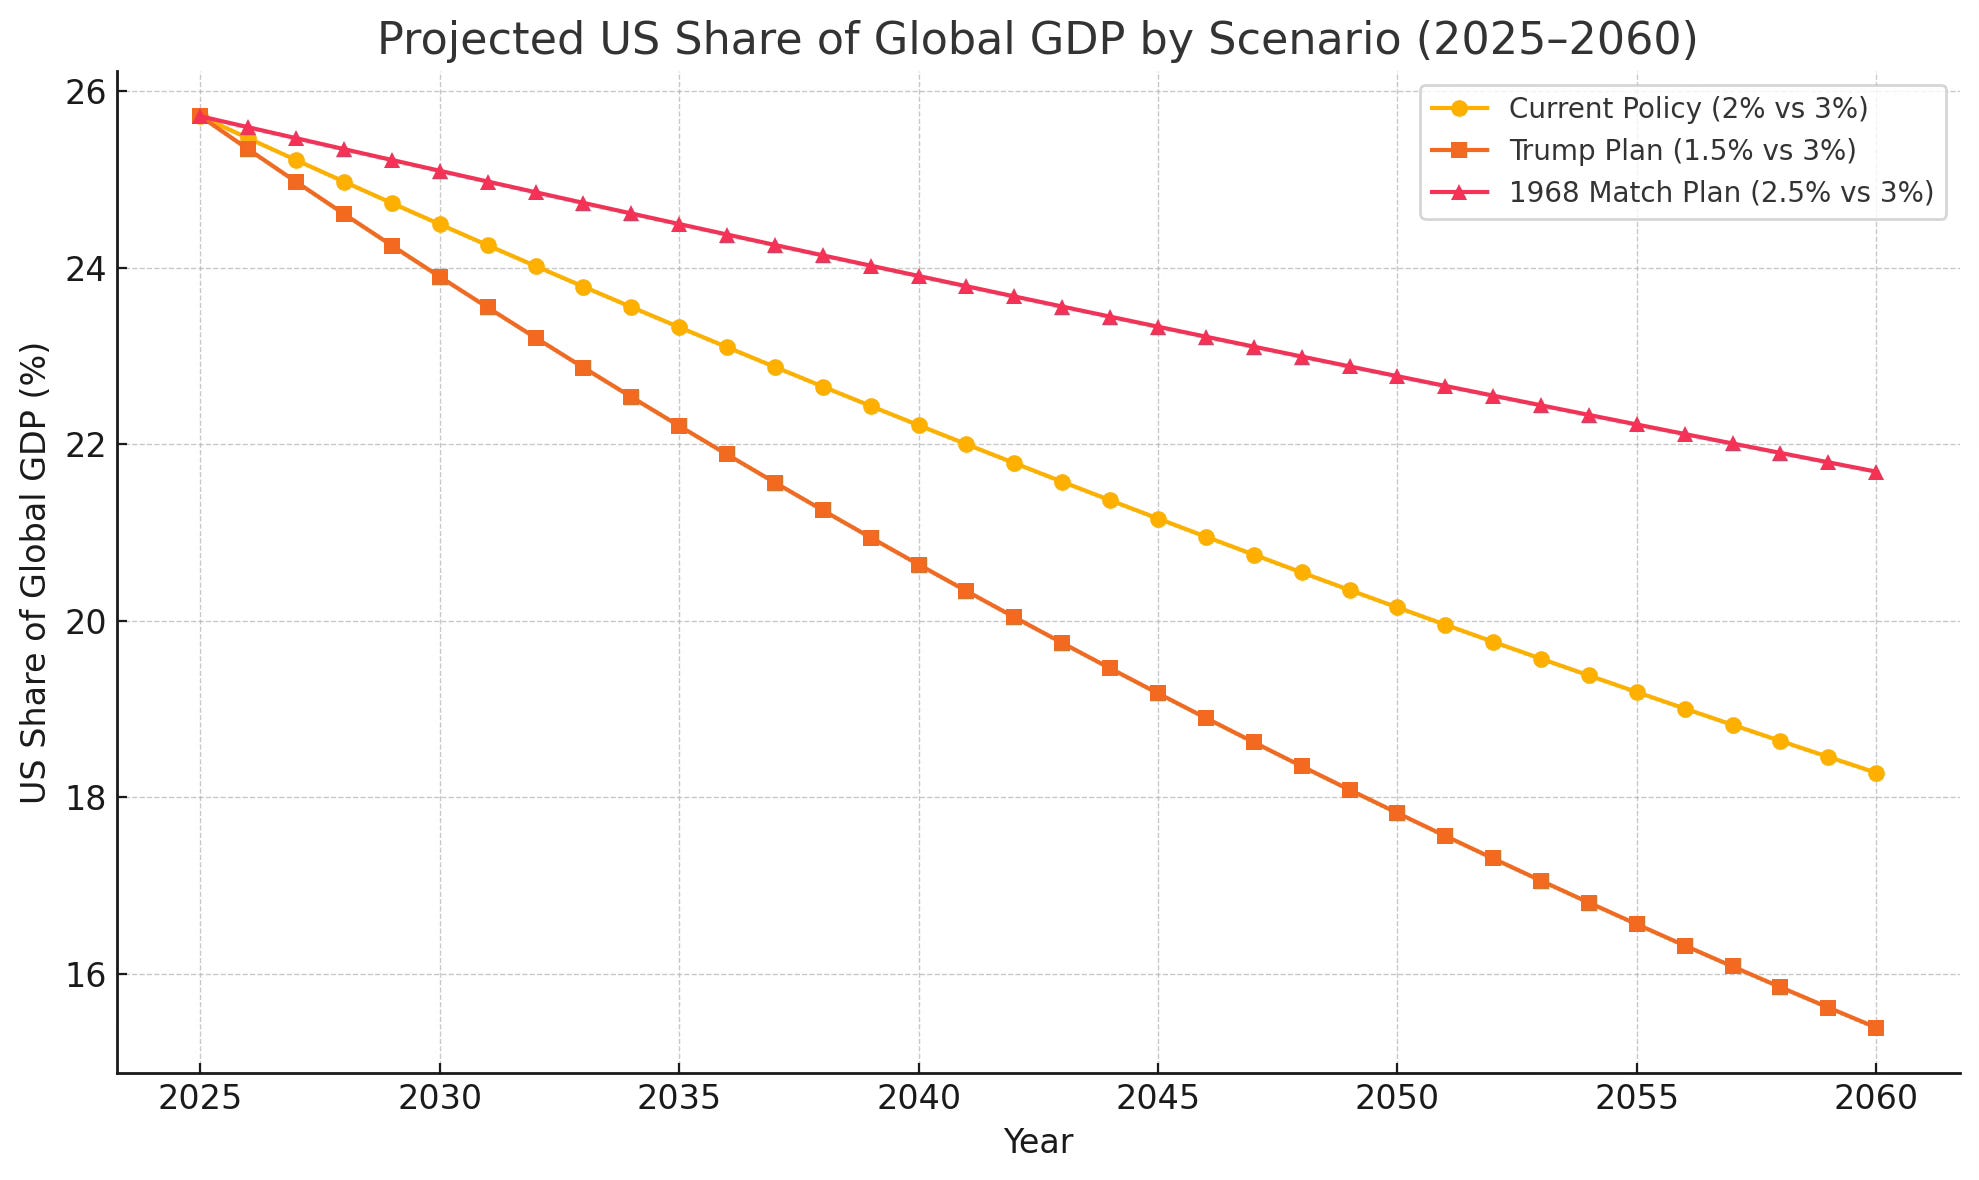
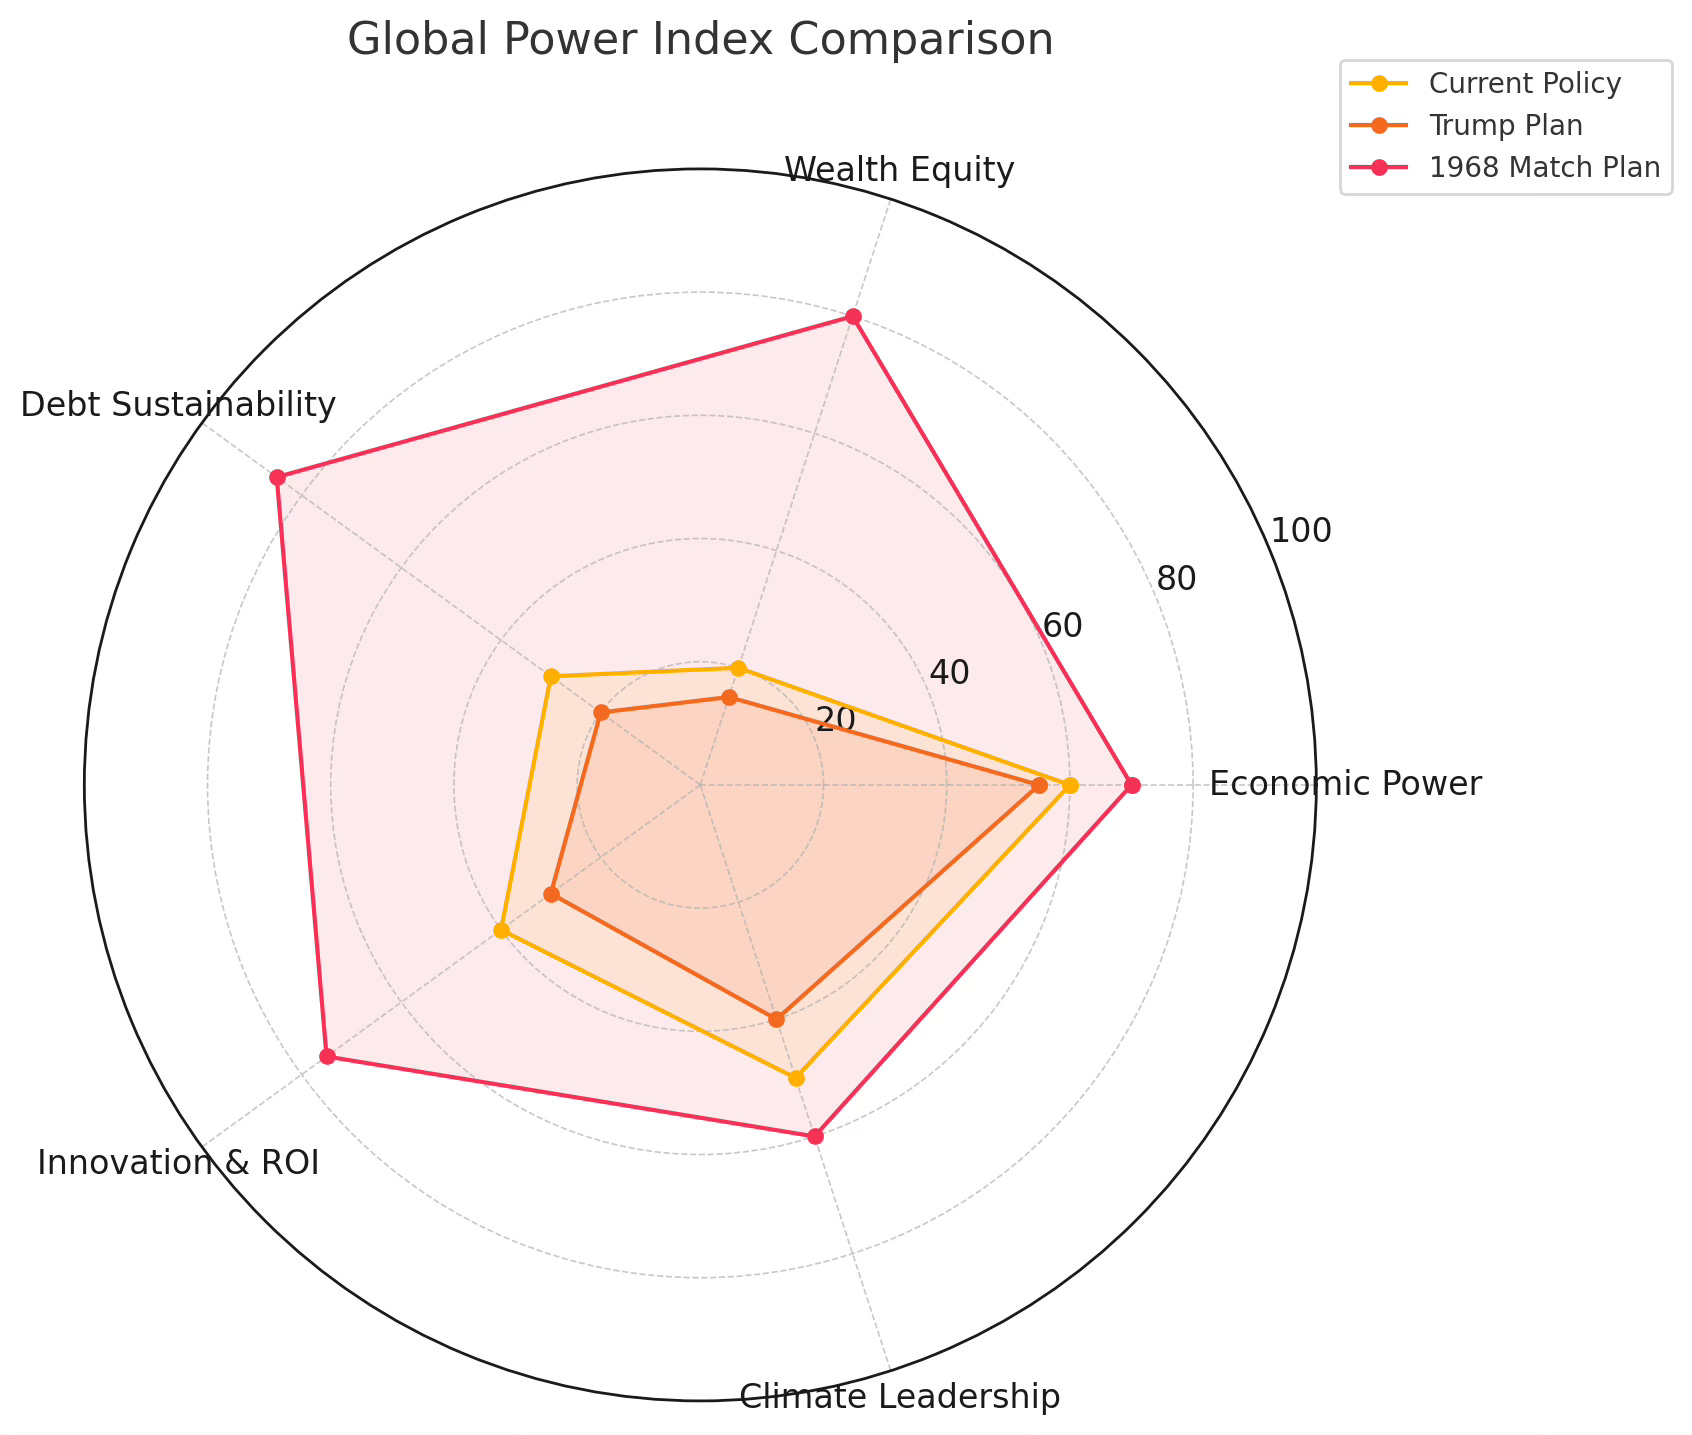
How we would stack up in the world:
Other Areas to explore for Cuts
Beyond the bold revenue-raising and investment measures in the 1968 Match Plan, the U.S. should also pursue targeted spending reductions and efficiency reforms in areas where waste or low social return is high. Key candidates include:
Corporate and Energy Subsidies
• Eliminate or phase out fossil-fuel tax breaks (e.g. the percentage depletion allowance, “Master Limited Partnership” loopholes).
• End blanket R&D credits for mature industries—shift to targeted credits for breakthrough clean-tech.
Expected savings: $50–$100 billion annually.Defense Overhead & Procurement Reform
• Cap annual growth of the base defense budget to inflation plus a small real term (e.g. 1 %).
• Mandate “middle-tier” acquisition: smaller, modular procurements rather than multi-decade, multi-billion dollar “big ticket” systems.
• Privatize or sunset underutilized bases and facilities.
Expected savings: $50–$75 billion annually without compromising readiness.Medicare & Medicaid Cost Controls
• Negotiate drug prices for Medicare Part D (like VA does) and use reference pricing.
• Expand value-based care pilots nationwide, tying payments to patient outcomes.
• Streamline eligibility and reduce improper payments via integrated data systems.
Expected savings: $100–$150 billion annually over the next decade.Tax Expenditure Review
• Systematically audit the 160+ “tax expenditures” (deductions, exclusions, credits) worth $1.7 trillion yearly.
• Sunset the least-cost-effective programs (e.g. the “active financing” exception, some mortgage and employer-sponsored insurance exclusions).
Expected savings: $200 billion–$300 billion annually if low-value items are trimmed.Entitlement Modernization
• Raise the Social Security full-benefit age gradually to reflect longevity (e.g. to 69 by 2040).
• Adjust the benefit formula’s top bracket “bend point” for high earners.
• Expand “chained CPI” for inflation indexing.
Expected savings: $50–$75 billion per year in the long run.Administrative Consolidation & Digitization
• Merge overlapping federal programs (e.g. dozens of small job-training grants into fewer, higher-impact ones).
• Drive a government-wide digital transformation to cut paperwork, reduce fraud, and accelerate service delivery (estimating a 15–20 % overhead cut).
Expected savings: $30–$50 billion annually.Infrastructure Maintenance Prioritization
• Shift from expanding capacity to maintaining existing assets (roads, bridges, transit).
• Apply “asset‐management” data analytics to delay new projects with low ROI.
Expected savings: $25–$50 billion annually, freeing funds for high-ROI green investments.
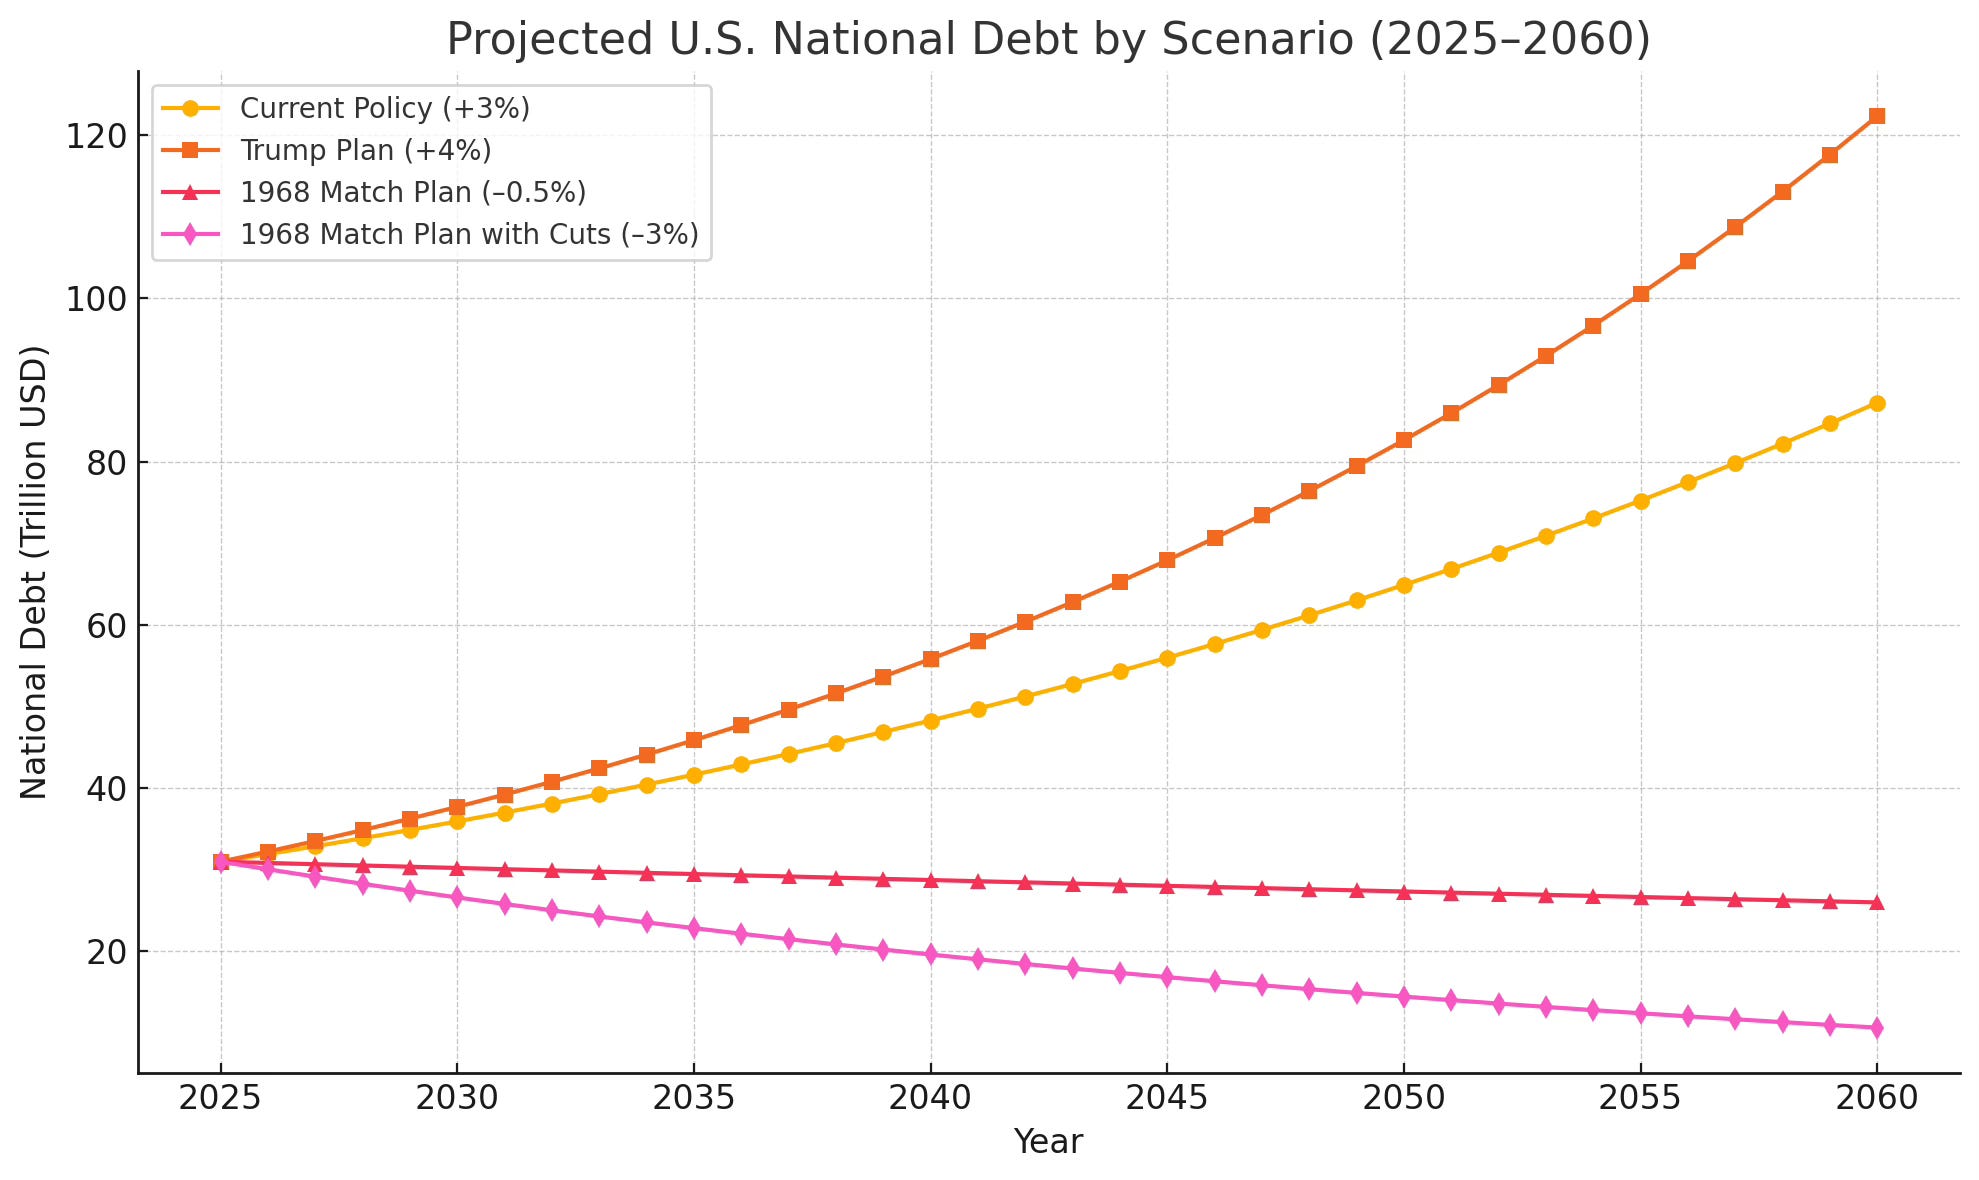
Why these cuts matter: They complement our redistribution and investment agenda by freeing up additional fiscal space, reducing deficits, and ensuring that every dollar spent delivers maximum social or economic benefit. Taken together, they could yield another $500 billion to $800 billion per year in savings, magnitudes comparable to the new revenues in the 1968 Match Plan, while without gutting core services or undercutting national security.
Conclusion
If we were to do both, our Gini Score would become the best of the western democracies, while also keep us the wealthiest, most profitable nations in the world.
In Closing
It’s time that we do what’s right for the American people, not only those that can buy their way to policy for themselves, looking at you Citizens United! We truly would become a nation that cares for its people, giving them all the chance to have a life of liberty and justice for all.
The sad thing is that all political leaders know this, this is not some magical proposal, the Tax Policy Center and Joint Committee on Taxation simulations show this. It’s even outlined in the Tax Policy Center’s “Options for financing a universal basic income” briefing (2024). They all just choose to focus on what the main donors want vs what the American people need.
It’s Time We Fix This For Real!
Sources include Federal Reserve SCF, IRS data, Tax Policy Center, JCT, Brookings Institution studies, and Government Outcomes Lab pilot analyses.
Progressive income‐tax revenue: see Tax Policy Center’s “Options for financing a universal basic income” briefing (2024) .
Capital‐gains parity: see Urban–Brookings Tax Policy Center models on ending preferential rates .
Net‐wealth tax: see Hutchins Center/Urban Institute simulations of 2–3% wealth levies
The data being used here is provided by OpenAI using multiple models and references.